
“We don’t fail because we are not intelligent or erudite enough; we fail because we don’t present our stakeholders with engaging material that will improve their ideas. We choose the medium which makes us comfortable, not the one our stakeholders would prefer.”
— Sam Ladner, Practical Ethnography (159)
Our work as ethnographers, as social scientists, is rich, experiential, relational, multi-dimensional and full-sensory. As often as we can, we immerse ourselves in communities and in landscapes and then—we heighten all our senses, turn down our ego and try to understand the context. Nothing is as important as context.
We document and analyze these contexts and the individuals and objects within them, refining them for a new context of service design or product development that is itself a whole new ecosystem of relationships, ethics, finances, goals, timescapes. Businesses and organizations have distinct customs, rituals, and standards for creating “evidence-that-counts.”
EPIC2019 is preparing a space for you to be experimental, even perhaps a bit uncomfortable, with how you present the work you’ve done or the work you’d like to do. Are you working with novel prototypes, materials, or research experiences? Is there something meaningful you’ve had to leave on the cutting room floor? Were there experiences documented that continue to delight or trouble? Extract a sound, recreate a lightscape, play with movement and the agency of hidden actors in your work. Invite interaction and interpretation. Be as low-def or as high-def as you want to be. This is a hearty invitation to craft a gallery installation that interacts with our community.
Inaugural Edition
The EPIC Gallery debuted in Hawai’i at EPIC2018. Program Co-chairs Dawn Nafus and Tye Rattenbury presciently and confidently held space for the unconventional, inquisitive, brave, honest, irreverent, relational, artful, and unformed. An exciting group of new and longstanding EPIC members stepped creatively forward. The 2018 theme Evidence meant being pulled by an undeniably strong current towards data—domesticated, industrialized, monetized. Data that was both fictional and concrete. This current was fed by artists and data designers like Giorgia Lupi and Stephanie Posavec whose transcontinental installation (now book) Dear Data democratized data analysis and validated the ordinary, everyday data sets we each produce.
“We chose evidence as the EPIC2018 theme in part,” Dawn explains, “to explore this question of why some things constitute evidence and not others. How is evidence changing? Language is hard and messy. We have a methodological advantage over desk researchers—we’ve got really good contextual knowledge.” EPIC2018 Gallery participants stepped through hard and messy language with color, light, sound and texture as tools, to present their valuable contextual knowledge.
The EPIC Gallery celebrates contextual, situated knowledge and the raucous clutter of life. Meg Kinney, principal of the cultural insights and documentary video firm Bad Babysitter, explains why she chose to participate in the gallery:
Papers and PechaKucha are one-to-many and the Gallery is one-to-one. It allows for a more contemplative experience and interaction between the audience and the piece. The form is not fixed so both the creator and the audience can bend how they want to receive and internalize the input. Gallery exhibits allow for nuance and some ambiguity. They don’t carry as much burden to be “right”, nor are they time-bound. They are more sensorial since they are tactile.
Agency
This year’s theme, Agency, invites even more play.
EPIC members’ research is largely business focused—from tech to health care to consumer goods—but also spans public service and nonprofit work. Each year we gather, ethnographic birds of a feather but diverse in background and position, to fortify each other. We can respectfully retreat from the daily demands of our organizations and markets to swim around the waters a bit. In this way, our community bends with agility, grace, humor and courage. In many ways, the gallery is an ideal site.
This year all EPIC Gallery installations will be featured in RISD’s ISB Gallery—a global destination for curators and design houses seeking emerging talent from the legendary college. ISB is also a coveted local gallery for contemporary professional artists. The risd:store 3D on Main Street is just one of a dozen art supply stores in Providence from which you can receive technical installation support and source materials on-site for refinement. We look forward to you filling RISD’s ISB Gallery with interpretations of the EPIC2019 theme Agency.
Concluding her book, Hello World, Being Human in the Age of Algorithms, mathematician and keen observer Hannah Fry pulls forward the legendary Kasparaov vs. Deep Blue chess game and highlights something Kasparov says about agency. Though it is her ending, it feels like a fitting beginning to our work crafting EPIC 2019. Hannah writes:
Here’s how Kasparov puts it, ‘When playing with the assistance of computers, we could concentrate on strategic planning instead of spending so much time on calculations. Human creativity was evermore paramount under these conditions.’ This is the future I’m hoping for. One where the arrogant, dictatorial algorithms that fill many of these pages are a thing of the past. One where we stop seeing machines as objective masters and start treating them as we would any other source of power. By questioning their decision; scrutinizing their motives; acknowledging our emotions; demanding to know who stand to benefit; holding them accountable for their mistakes; and refusing to become complacent. And it’s only right that it’s a job that rests squarely on our shoulders. Because one thing is for sure. In the age of the algorithm, humans have never been more important.”
Agency takes many forms, but clearly all of them involve a unique voice. We’re looking for yours.
Snapshots from the EPIC2018 Gallery
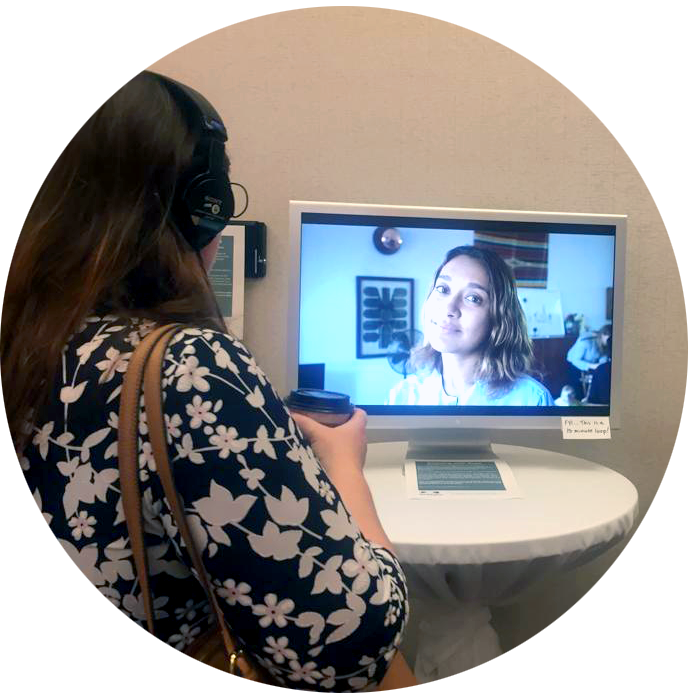
Dancing with Data and the Choreography of Evidence aimed to viscerally pull the viewer into the tension between knowledge and meaning, what is observed and what is measured, algorithm and human. Using a combination of video/photographic portraits of people juxtaposed with audio voiceover of ‘hard data narrative’, viewers confronted both dissonance and harmony between what they see and what they hear.
—Meg Kinney & Hal Phillips · Bad Babysitter
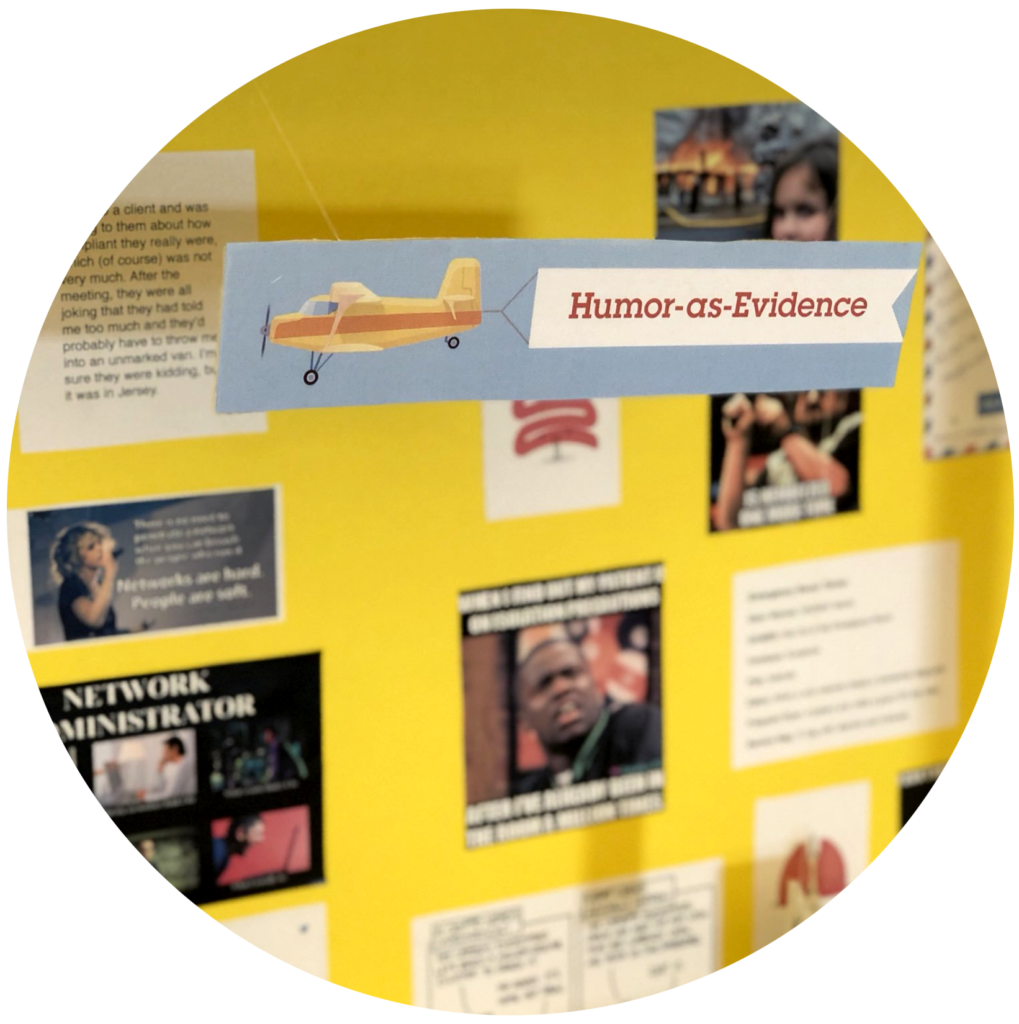
Occupational Humor Wall was an interactive meditation on humor as a special class of user data. Populated with jokes, memes, anecdotes, comics, etc., from prior design research, the installation had a section for viewers to add examples of occupational humor from their own areas of study or expertise.
—Meghan L. McGrath · IBM

Making Time Tangible: Life in a Minute was concerned with the social implications of technology and aimed to make time tangible—probing people to think critically about the value of time and to reveal underlying attitudes. The piece facilitated playful, tangible interactions to encourage people to reconsider their personal time allocation for career, community, education, family and play.
—Joyce S. Lee, Dylan R. Fox & Varshine Chandrakanthan · University of California, Berkeley
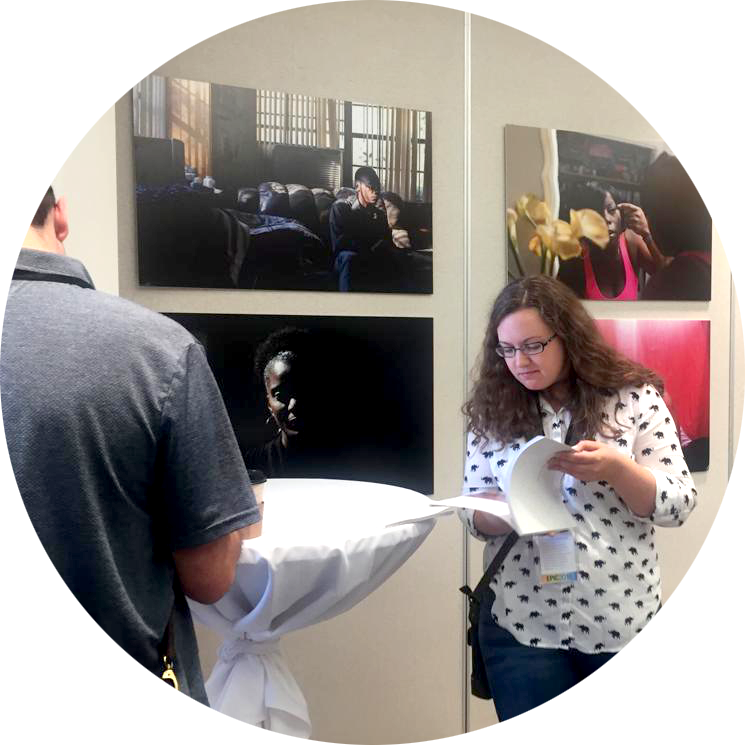
Meet Me where I Want to Be provided visual evidence for the needs, challenges, opportunities, and aspirations of people diagnosed with HIV. The photographer worked with the research participants to capture their daily lives, inviting the participants to shape the photoshoots to present themselves as they wanted to be seen. They challenged the typical depiction of “patients” as seen through the perspective of the healthcare system—as either tragic victims or triumphant survivors.
—Brendan Joseph Muha & Mads T. Nielsen · ReD Associates
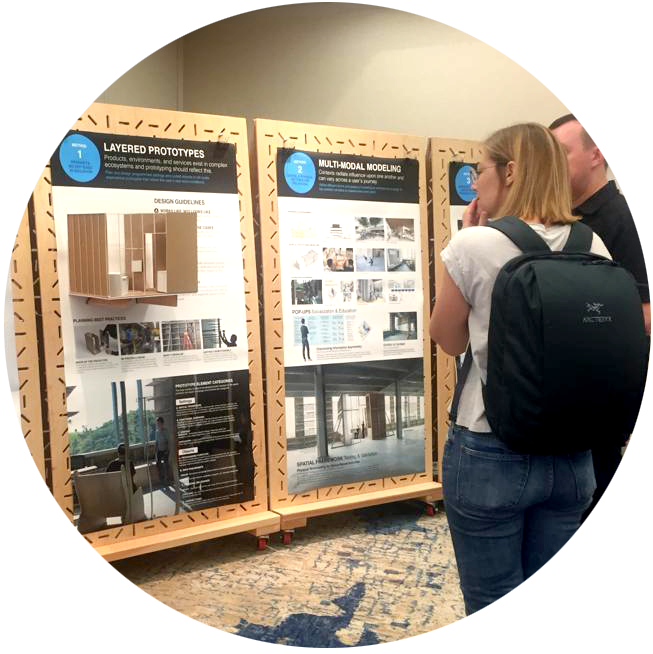
Spatial Experience Design (SXD) presented experiential prototyping that applied ethnographic research and strategy approaches from UX to the design of physical environments. Spatial Experience Design (SXD) was presented as a holistic approach to plan, design, prototype, and test “layered spaces” where digital and physical settings interact with one another.
—Brian Strawn · University of Hawaii; Alisa Weinstein · Google; Rebecca Buck · Varo Money Inc

Data Sense was an online software prototype designed to facilitate situated exploration of datasets that ordinary people might encounter in their daily lives, such as data from fitness tracking devices or environmental monitors. The goal was to enable people with a broader set of backgrounds to re-situate and contest claims about data.
—Dawn Nafus · Intel
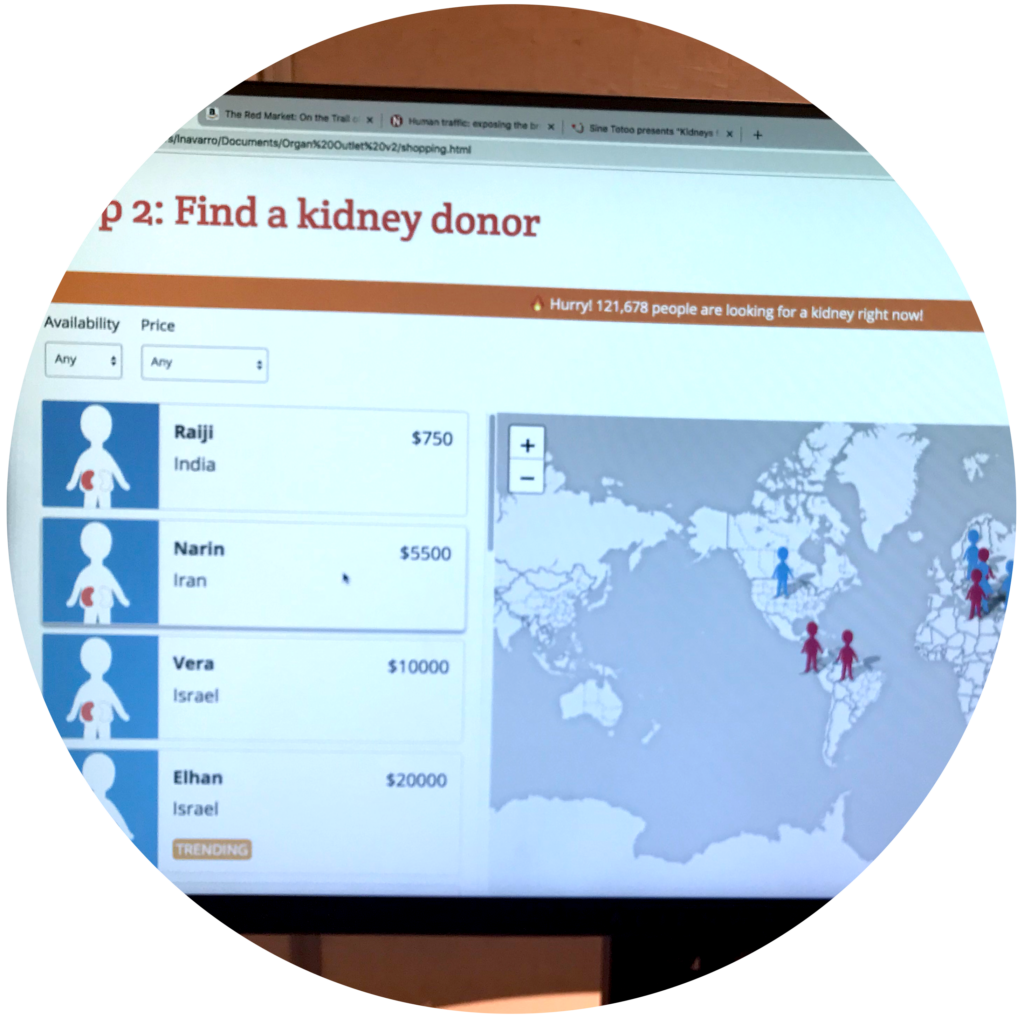
Organ Outlet: A Speculative Kidney Shopping Experience was a speculative data visualization platform that critiqued the global organ trade. Based on ethnographic text and journalistic pieces, it aggregated information on price points and stories of kidney sellers around the world, and places them within the narrative of a satirical, “user-friendly” e-commerce website.
—Lorina M Navarro · Independent
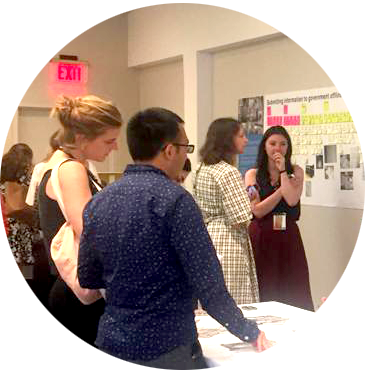
Submitting Information to Government Offline presented a UK-government discovery into to the submitting and processing of offline information (forms). The installation focused on services in government without access to software development resources and translates the problems for users into possible design solutions
—Ciara Green · Independent
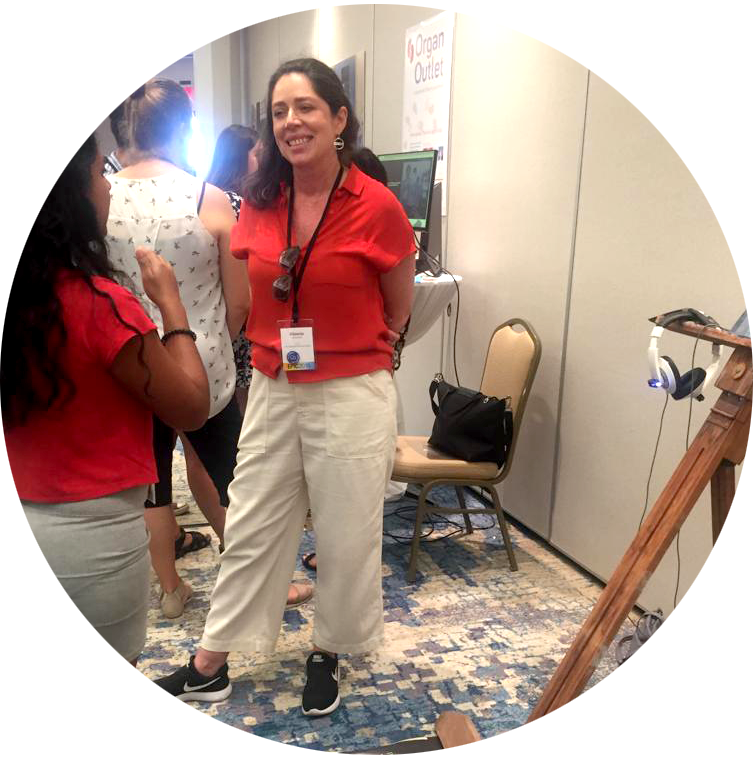
Nature Deficit Disorder Clinic was an invitation to observe, explore, reflect and sense how one might be personally, organizationally, and more broadly as a community or society, impacted by lack of routine contact with nature.
—Jennifer McDougall; Prateeksha Singh · OCAD University & Nourhan Hegazy · Immigration, Refugees & Citizenship Canada
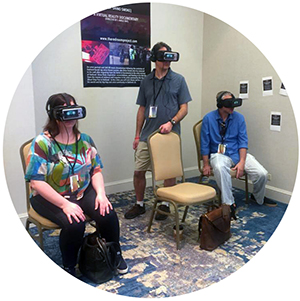
The Red Room Project was a 360 VR video that followed the evolution of rap artist Shane Lassiter aka Shino Smoke from Sacramento to Oakland. This VR story took viewers beyond his healing “Red Room,” in Sacramento to a saloon in downtown Oakland (at one of his shows) to the Fruitvale neighborhood of Oakland.
—Adele Ray · Berkeley City College
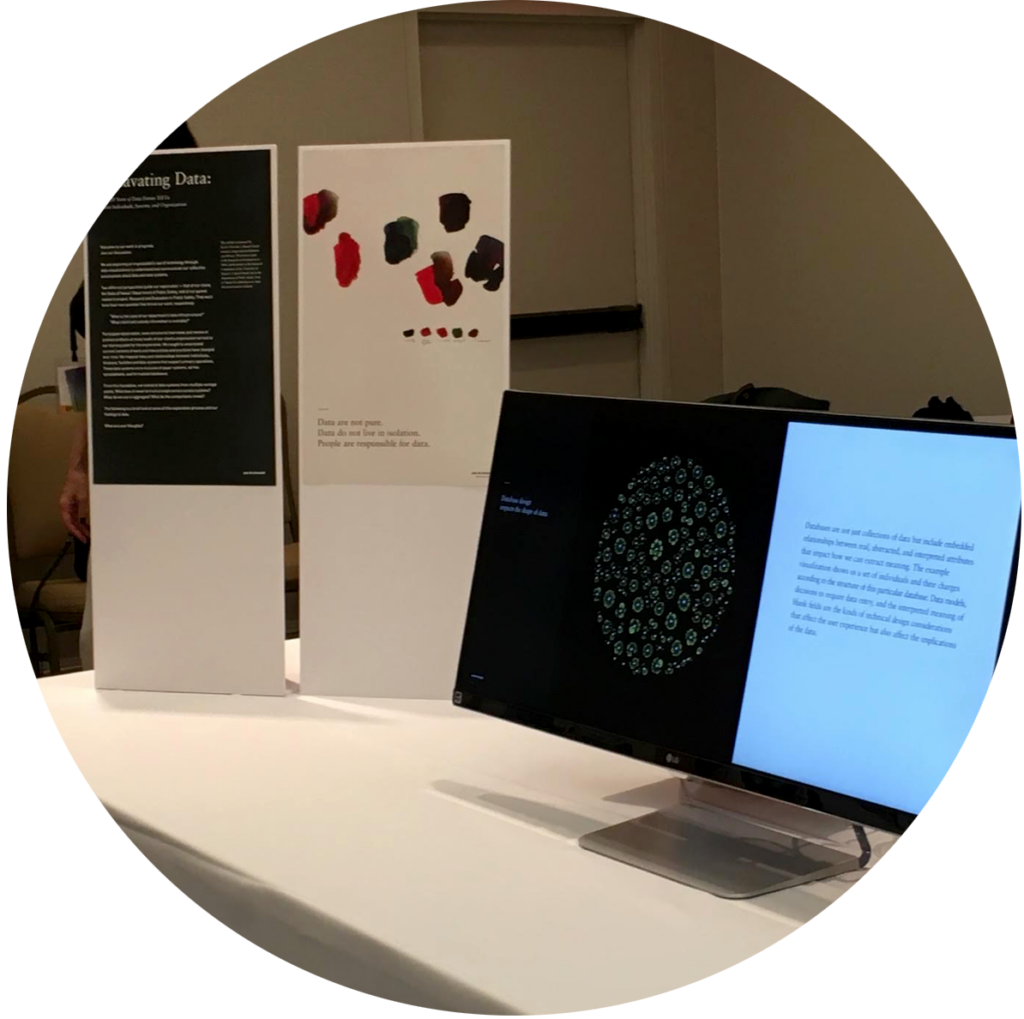
Excavating Data: What 20 Years of Data Entries Can Tell Us about Individuals, Systems, and the Organization that Created Them was an exploration of an organization’s use of technology through data visualizations to understand and communicate our collective assumptions about data and data systems. Looking at data systems from multiple vantage points, what does it mean to track a single person across systems? What do we see in aggregate? What do the comparisons reveal?
—Cara Oba, Kyle Oba, Alicia Dornadic & Jill Axelson · Pas de Chocolat
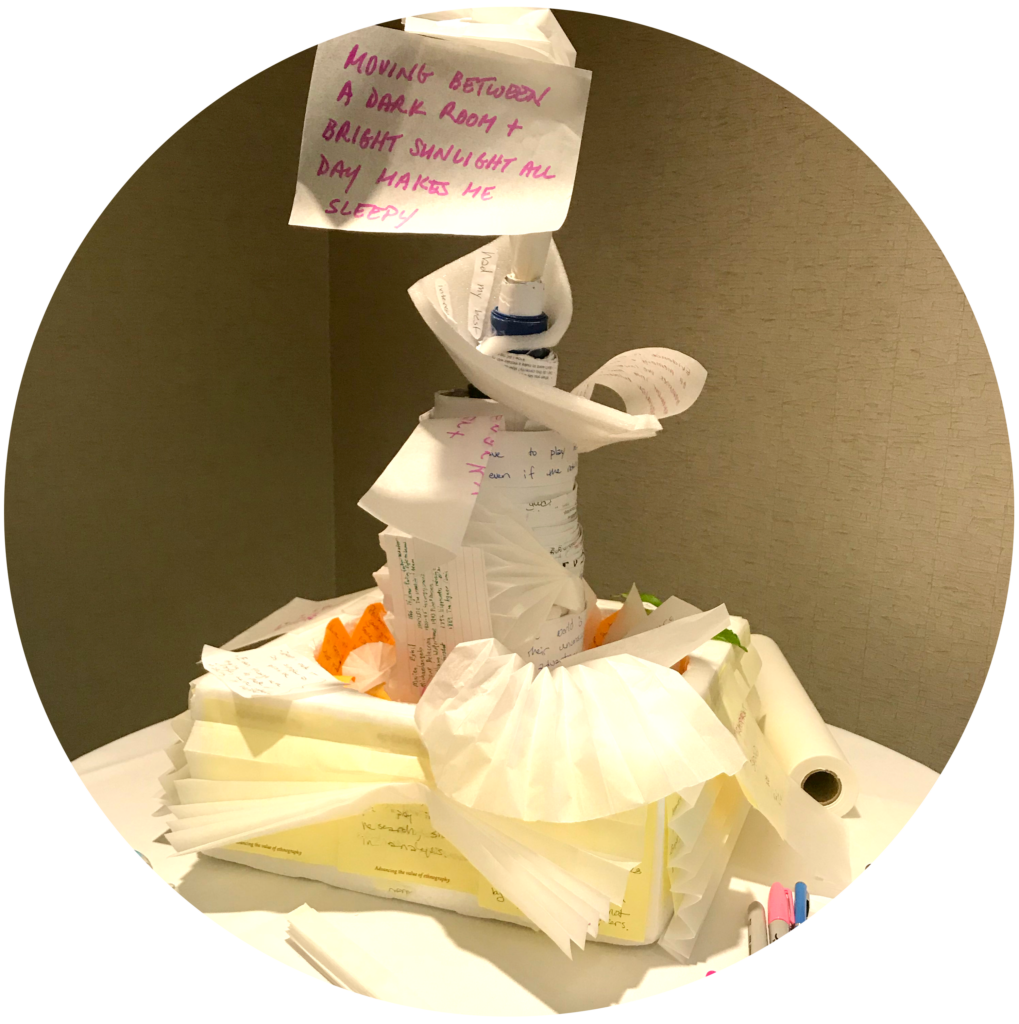
Thicker explored the possibilities of repurposing and re-contextualizing evidence from past projects by asking EPIC members to make thick data, thicker. Does ethnographic evidence live and die with every beginning and ending of a project, or does past evidence seep into current projects? If we guard against past evidence from influencing our current work, are we inhibiting wisdom or preserving integrity?
—Vyjayanthi Vadrevu · Rasa
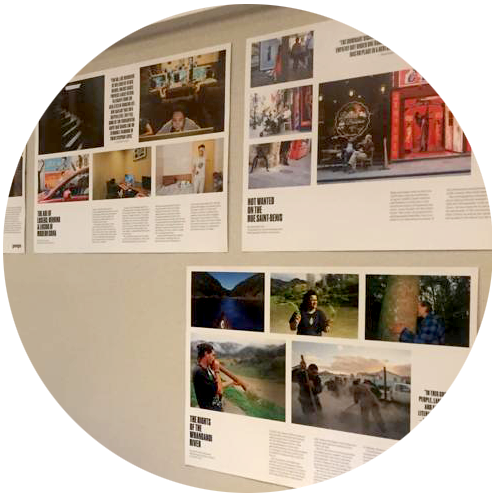
Insights on Insights: Photography as Commentary on Ethnographic Analysis combined photography and ethnographic writing to encourage community dialogue and demonstrate how pairing image and narrative produces richer material.
—Aliah El-houni & Anya-Milana Sulaver · Peeps Magazine
RELATED
Reassembling the Visual, Lucy Kimbell
Physicalizations of Big Data in Ethnographic Context, Jacob Buur, Sara Said Mosleh & Christina Fyhn Nielsen
Map Making: Mobilizing Local Knowledge and Fostering Collaboration, Noral Morales & Salomon Gonzalez
Data, Data, Everywhere, but Who Gets to Interpret It? Dawn Nafus


0 Comments