Case Study—One of Uber’s company missions is to make carpooling more affordable and reliable for riders, and effortless for drivers. In 2014 the company launched uberPOOL to make it easy for riders to share their trip with others heading in the same direction. Fundamental to the mechanics of uberPOOL is the intelligence that matches riders for a trip, which can introduce various uncertainties into the user experience. Core to the business objective is understanding how to deliver a ‘Perfect POOL’—an ideal situation where 3 people in the vehicle are able to get in and out at the same time and location allowing for a more predictable and affordable experience. This case study argues that, for a reduced fare and a more direct route, riders are willing to forego the convenience of getting picked up at their door in exchange for waiting and walking a set amount to meet their driver.
This case study explores the integration of qualitative and quantitative research to understand user trade-offs. Methods utilized were in-person interviews and two large-scale surveys: a maxdiff and a conjoint, each with a different purpose. The study started with a multi-city qualitative research study designed to understand how users make trade-offs among their transportation options, suggesting key characteristics of a ‘Perfect POOL.’ The team followed up with a maxdiff survey to validate these characteristics and identify the factors most important for riders’ decisions. A customized conjoint survey was then built to study what values each product feature contributes to maximize rider opt-in to the ‘Perfect POOL’ product. The team subsequently explored ways to translate the trade-offs revealed by the conjoint survey back into the product experience. This case study will discuss the conjoint survey’s outcomes and implications that directly confirmed the hypothesis that riders are willing to make experiential trade-offs. Learnings from this multi-phase research led to the initial Beta-launch of Express POOL in November 2017.
INTRODUCTION
Uber started with a simple concept—press a button and request a ride to your destination. Founded in 2009, Uber is an on-demand transportation platform that enables individuals to get a ride using their mobile phone. What started as a luxury ride service quickly became a global logistics platform changing how people move around. Today, Uber is available in more than 600 cities around the world, transporting riders in hundreds of languages across dozens of countries. Uber is committed to making transportation safer and more accessible, reducing the congestion impact of urban transportation by getting more people into fewer cars, and creating economic opportunities for people to work on their own terms. Core to realizing this mission is promoting carpooling at scale to enable everyone to afford the experience of Uber.
UberPOOL was originally launched in August 2014 as a service that makes it easy for people headed in the same direction to share their journey. The overall benefit was lower costs for riders and a higher volume of paying passengers for drivers. Since its launch, uberPOOL has become a popular carpooling service for riders worldwide and has served over one billion rides. Moreover, uberPOOL constitutes a large portion of the company’s overall business. As such, the service satisfies customer needs, strategically grows Uber’s business, and benefits cities by improving the usage of each car on the road.
That said, prior user research identified some critical rider experience pain points on uberPOOL, particularly around routing and affordability. Poor matches cause significant routing detours and prices are not affordable enough. Combined with the goal of delivering a more efficient and enjoyable service, the team focused on creating the ‘Perfect uberPOOL,’ an ideal situation where all 3 people in a vehicle are able to get in and out at the same time, leading to a more predictable and affordable experience.
The research team, comprised of user researchers and data-scientists, devised a multi-phase research study approach to investigate what and how to create the ‘Perfect uberPOOL’ from the riders’ point of view. The research started with an in-depth qualitative study across multiple cities to understand how riders make trade-off decisions when choosing transportation. Findings from this study informed the core characteristics of the ‘Perfect uberPOOL.’ As a result, the Product, Engineering and Research teams formulated a set of refined hypotheses:
- Riders are willing to wait for a short period and walk to an optimal pickup location in exchange for a cheaper price and a faster, more direct route to their destination;
- Riders are willing to trade a predictable pre-trip experience for a lower price and a higher quality on-trip experience with fewer detours.
The dual purpose of this paper is to demonstrate collaborative research processes and to assist readers in executing similar research methods. Each stage of the research is discussed, detailing how the team collaborated in continuous and interdependent knowledge building. Details on the methodological approach and execution are intentionally included to support similar types of inquiry.
Section one introduces the mechanics of the original uberPOOL, beginning with an overview of how the product works and the basic unit economics underlying it. Included is a walk-through of the current interface design of uberPOOL. Section two discusses the motivations to improve uberPOOL and the existing concerns across the three main actors: Uber as a company, riders and drivers. Section three focuses on the in-depth qualitative study conducted to understand how riders make trade-off decisions when choosing their transportation. The research suggested key characteristics in creating a ‘Perfect POOL.’ Section four is devoted to the design of a maximum differentiation (“maxdiff”) analysis survey that was constructed to validate the most important factors for a rider when choosing uberPOOL. Outcomes from the maxdiff survey helped the team focus on a core set of features. Section five discusses the conjoint survey that was then built to understand the value of each product feature in order to maximize rider opt-in. The conjoint survey design with its implementation and analysis will be discussed in detail. Section six is an overall summary of the research outcomes and business learnings that led to the launch of the resulting product named Express POOL in November 2017.
DYNAMICS OF UBERPOOL
The fundamental objective of uberPOOL is to promote the efficiency of the service by filling as many available seats in a car as possible, while ensuring an enjoyable and delightful experience for both riders and drivers. With more riders in a vehicle, the costs of riding are shared across more individuals. A lowered cost of transportation provides greater access for a broader set of riders and can unlock new use cases. UberPOOL is also strategically important for Uber’s growth as it allows the company to service more rides with more paying passengers in the car for drivers. In essence, uberPOOL can create a holistically beneficial scenario wherein riders benefit from lower fare costs; drivers’ time and vehicles are optimally utilized; and Uber is able to fulfill more trips.
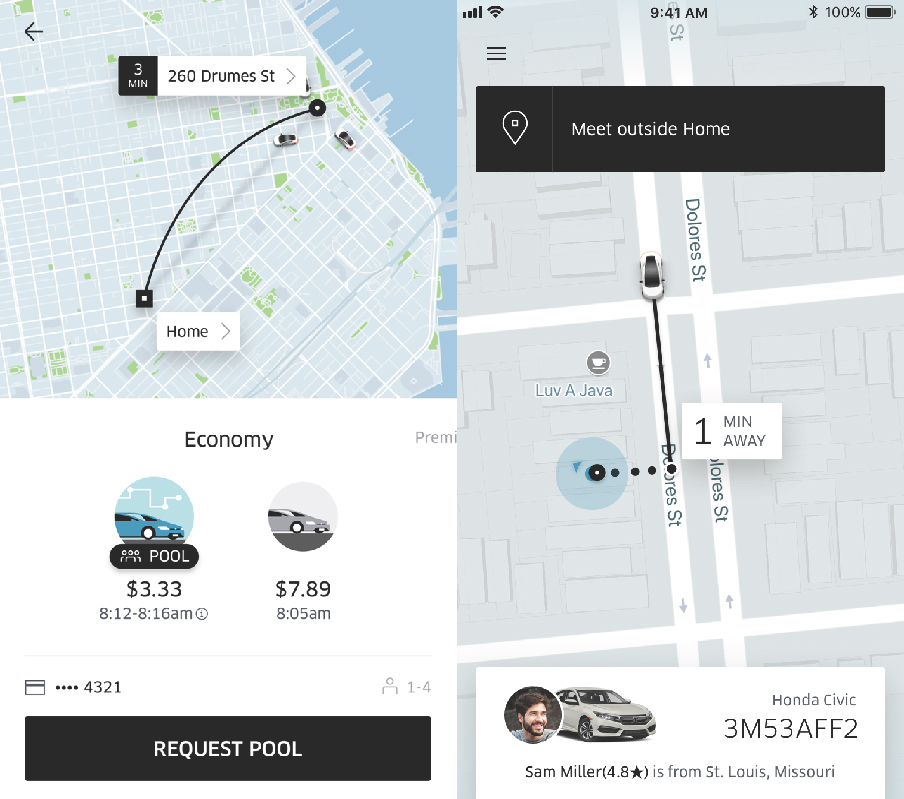
The following is a walkthrough of the user experience of ordering an uberPOOL as of September 2017. When a rider chooses uberPOOL in the Uber rider app, they will be shown an upfront fare along with an estimated time of arrival (“ETA”). Riders can also see alternative service choices, such as uberX (a solo-ride with no additional riders1), as well as compare cost and time estimates. Once a rider inputs a destination and requests an uberPOOL, he or she will be connected to a driver and be given that driver’s name, estimated pick up time (“EDT”), license plate number, vehicle description, and the names of other riders in the carpool. In the Uber app riders can also see the driver’s route and the location where other riders will be picked up and dropped off.
Figure 1. Interface design uberPOOL in the Uber rider app. Designs as of mid-2017.
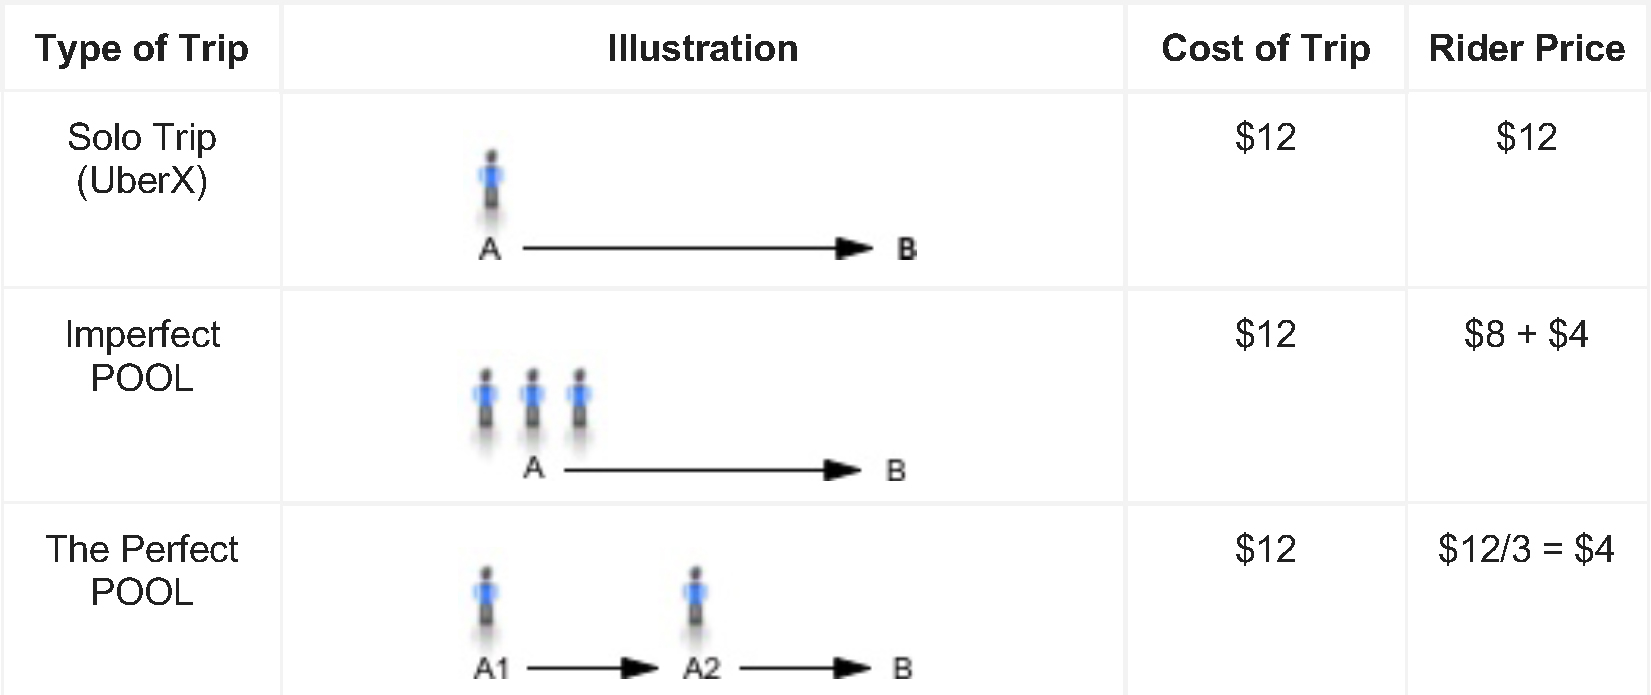
This popular carpooling service is available at a lower price because riders are able to split the cost of the trip across multiple riders. With uberPOOL, a rider can pay as much as 50% less than uberX, depending on the city, making it most often Uber’s cheapest service. In terms of the costs of providing the trip, it includes payout to the driver and Uber. For illustrative purposes, a trip going from point A to point B might cost $12 in total. A rider’s cost for that trip will depend on both the number of riders splitting the cost, and the amount of trip overlap among them. Figure 2 illustrates the unit economics of an uberPOOL across 3 simplified scenarios:
Solo Trip (uberX) – In this scenario, there is only one rider going from point A to point B. If the cost of the trip is $12, then he/she will be responsible for the entire cost of the trip. This would have the highest rider cost out of the three scenarios. In terms of Uber’s ecosystem, if every rider requested an uberX, then the platform would need a significant number of drivers to fulfill all the requests. If Uber cannot ensure that there are enough drivers, then riders will have to experience longer wait times, resulting in a less ideal experience along at a higher cost.
An Imperfect POOL – For the two riders in this scenario, one might be going from point A to point B, when the second rider is picked up halfway to the destination. The cost of the trip at $12 will be split unevenly between the two. That is, the first rider will be charged $8 for the entire trip and the second rider will pay $4 for only riding halfway. As a result, the first rider receives a small discount paying $8 instead of $12 for riding alone. However, he/she will likely experience added detours and time delays due to picking up the second rider on the way to point B. For Uber, if the second rider is out of the way for the first rider, the cost of the trip for Uber will actually exceed $12, as the trip takes more time and is of greater distance.
A Perfect POOL – This is a situation when a vehicle is transporting three people and they are able to get in and out at the same time and location. Accordingly, a perfect POOL allows riders to have an experience closer to that of a solo trip, without additional pickups or detours along the way. Each rider will pay a much lower price of $4 per person. For Uber, the cost of the trip will not exceed $12, since there are no additional detours. Moreover, the three rider requests are satisfied with one vehicle, providing the most efficient use of the vehicle and the driver’s time. Therefore, cars on the roads can be utilized more efficiently while providing riders with a more affordable option.
To summarize, these three scenarios illustrate the intricate connection across riders, drivers and Uber as a company, as well as the efficiencies of uberPOOL and its concomitant costs and experiential consequences.
Figure 2. Unit Economics of uberPOOL in 3 Theoretical Scenarios. ‘Cost of trip’ consists of the driver payout for providing the service. ‘Rider price’ is the price that the rider will have to pay. Numbers across the 3 theoretical scenarios are for illustrative purposes only.
Since its launch, uberPOOL has made significant improvements; nevertheless, cases of ‘imperfect POOLs’ still exist and impact the experience and economics of the product. With uberPOOL contributing more than 20% of all Uber trips in cities where it is available, poor experiences lead to major consequences to riders, drivers and the future of the business at a massive scale. Therefore, the opportunity to redefine uberPOOL can help set Uber up for long term success by eliminating sub-par and unsatisfying trip experiences for both drivers and riders, while attaining sustainably optimal and viable unit economics.
The following section discusses the team’s motivations to improve uberPOOL and the existing concerns affecting the three main actors: Uber as a company, riders and drivers.
Removing inefficiencies – uberPOOL represents a significant portion of Uber’s business; results of inefficiencies (like those inherent in imperfect POOLs) lead to a higher cost for riders, drivers and Uber. While the minimum efficiency reduction is defined by the overall business, the Product team needs to identify how to realize this – part of which is to identify what the system needs in order to be technologically efficient while meeting the needs of customers.
Flywheel effect – uberPOOL is based upon a shared ride concept, by which the experience and economics only get better as more people use it. For example, the greater the volume of riders, the higher chance of finding the best pairing of others going to the same destination. Such a pairing would also translate to shorter rider wait times. For the business, it can create a virtuous cycle of riders wherein the product market fit and economic accessibility allows the company to scale along with the density of usage. This in turn creates a flywheel effect that can enable the product to improve.
Affordability – Achieving perfect POOL trips significantly lowers the trip cost of each ride and rider’s price. This helps Uber reach a broader set of riders and unlock new use cases for riders. Past research has shown affordability to be a key factor leading to greater rider adoption. As riders prefer to use Uber as a service more, it may be cost-prohibitive on on a routine and consistent basis. Moreover, this situation could be further exacerbated when riders need the service during times that are busier and, hence, more expensive. As such, perfect POOL trips should be able to reduce the cost of the ride and make the service more financially accessible for a broader set of riders.
Streamlined Trips – Drivers typically complain about the way imperfect POOLs require more time and effort to complete trips, which is mentally taxing for them. Moreover, drivers have mentioned emotional discomfort and burden from interacting with riders upset about the added time with POOL. In contrast, streamlined trips following an organized plan result in simplified drivers experiences that drives describe ‘magical,’ particularly when the coordination of pickups and routes is straightforward and efficient for everyone.
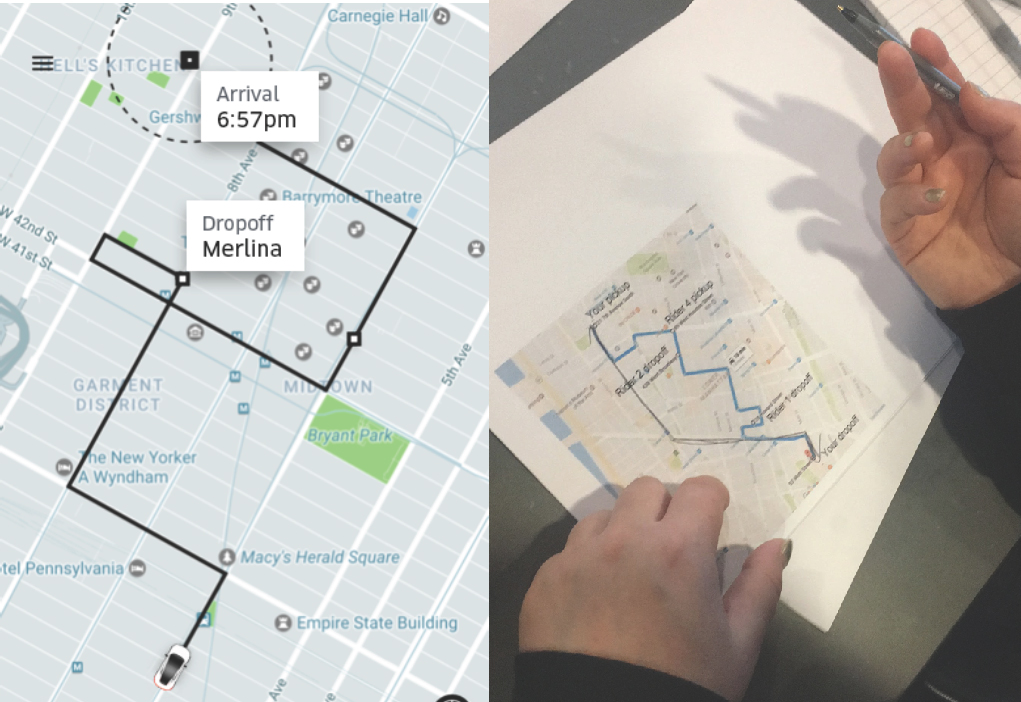
Riders also complain that picking up co-riders can make trips unpredictable and inconsistent. A rider from New York City said “I will never take POOL when I need to be somewhere at a specific time” – a common sentiment. On the left of Figure 3 is an example of an imperfect POOL trip in New York City with inefficient co-rider pickups and dropoffs characterized by suboptimal zigzagging and looping. On the right of Figure 3 is a photo of a rider sketching an ideal route along main street arteries in New York City. This rider is not alone in preferring simplified routing. While riders enjoy the cost savings of imperfect POOLs compared to the price of a solo trip, poor matching can cause them undue frustration.
Figure 3. Example of an imperfect POOL trip in New York City (Left). Rider shares opinion of an ideal route on uberPOOL (Right).
Research Design
With problems and opportunity defined, the team pursued a ‘Perfect POOL’ solution that would meet the needs of customers and business objectives of Uber alike. To do so, a multi-phase research plan was devised to layer learnings to drive actionable insights. Using a novel approach, the team integrated both qualitative and quantitative methods uniquely suited to revealing the optimal technical directions and potential product features of the ‘Perfect POOL.’ A guiding principle of the research was to ensure that learnings derived from one stage of research would build upon the next to attain the most comprehensive and actionable findings.
Figure 4. Main research stages prior to product launch. Post-launch research studies will not be discussed in this paper.
First and foremost, the team wanted to understand how and why people make the transportation decisions they do. The team started with a qualitative user study utilizing the Jobs-to-be-Done framework (Christensen, 2004). Through in-home rider interviews and ride-alongs, trade-offs in riders’ travel choices were revealed. This allowed the team to identify the travel decision criteria that would evolve into a comprehensive list of considerations most relevant to rebuilding uberPOOL.
To complement the qualitative, the team next applied a quantitative approach, using the list of travel decision criteria into a maxdiff survey. The maxdiff used a best-to-worst scaling approach to identify, narrow and validate the relative importance of trip attributes for both user and product. This instrument resulted in an initial set of product levers.
A subsequent conjoint survey populated with the final list of product levers was used to populate a designed to understand the likelihood that riders would consider waiting and walking for a cheaper ride. This unique and novel method simulated realistic purchase scenarios for respondents. The team subsequently explored ways to translate the trade-offs revealed by the conjoint survey back into the product experience. While this paper primarily focuses on the first three phases of research mentioned above, the final section will discuss the important considerations and usability findings needed to translate conjoint insights into product design decisions. The sum of these learnings guided the final ideation of the new product experience.
IN-HOME QUALITATIVE RESEARCH
Everyday people travel to different places for a purpose. Whether an individual is on their daily commute to work or a family is traveling for a vacation, everyone has a specific purpose for their journey. To fully understand an individual’s goal or ‘job,’ it is important to understand the progress they are trying to make under particular circumstances (Christensen, 2004). When a customer buys products or services, they are ‘hiring’ them to complete a specific job. Customers return if the job is well done. If not, customers will replace the product or service, and look for alternatives that can better satisfy their goal. Therefore, knowing a customer’s diverse set of needs and what they are trying to accomplish in a given circumstance explains why customers choose what they use today.
For the purpose of this study, the research team approached the work of understanding ‘jobs’ through a three-step process. First, the team identified the customers’ goals by paying close attention to the context and circumstances that shape the customers’ thinking. Second, the team took into account all the functional, emotional, and meaning-based dimensions that govern a transportation choices. This requires knowing what factors constitute each dimension and how customers think through these factors. Third is knowing how customers reason through and evaluate the type of trade-offs they are willing to make. Given a set of choices, customers evaluate and select available options against their ‘jobs’ specific to the circumstance. Holistically, this process is key to knowing why customers stay with their existing choice, or change to alternate choices.
Qualitative Research Logistics
The research team started the study with a series of in-home interviews with riders in different locales. The study included 23 users across various neighborhoods in Chicago and Washington D.C. The cities were selected based on city density, rider diversity, product performance and business priority. Participants included a mix of prospective riders, new riders and tenured riders spread across specific predominant use cases. For example, the team categorized the main use-cases as: commute to or from work, airport or business travel, social outings and family errands. The team screened for participants exhibiting behaviors within these key uses cases to ensure that their travel experiences were within the realm of those that Uber supports.
Each participant session lasted 2.5 hours and was conducted at their house. The session was comprised of three main sections: a general travel-mapping exercise to understand the rider’s lifestyle and travel occasions; a job exploration section to understand the factors and decision-making process; and finally, a ride-along section to capture the context and nature that govern a top key job.
The interview portion of the study is focused on understanding participants’ feelings towards travel and a brief overview of their approach to travel. The team employed a travel mapping exercise as a grounding document to anchor and catalog all their travel occasions. This mapping exercise provides a systematic framework for soliciting discussion points. Each item on the travel map would indicate a particular occasion. For example, one participant mentioned taking their child to school every day as part of their daily routine. Therefore, dropping their child at school is one of their top travel occasions. As the discussion progresses, each occasion is built out with greater detail, uncovering details on the who, when, and what of that particular circumstance. This process of documentation provides an initial overview of the types of occasions that riders have as part of their travel.
The second portion of the research study is an in-depth discussion of each travel occasion to understand the complete breadth of jobs that are associated with each occasion. In this study, Ulwick’s eight fundamental process steps were utilized to guide the discussion of each occasion. The steps were to: define, locate, prepare, confirm, execute, monitor, modify and conclude (Ulwick, 2016). The first step, ‘Define,’ requires understanding the participant’s main objective. Each following step is a slight progression of their process, demonstrating how participants make calculated trade-offs between various needs when considering their transportation choices.
Qualitative Research Learnings
This research surfaced the breadth and interaction of the various functional, emotional and meaning-based factors that arise in users’ travel decisions. This summarization framework is a simplified adaptation from Maslow’s Hierarchy of Needs, a common framework used for organizing human motivations (Maslow, 2013). According to Ulwick, a ‘functional’ job is the core task that has to be accomplished. An ‘emotional’ job is defined as the way customers want to feel or want to avoid feeling during the process (Ulwick, 2017). And finally, a ‘meaning-based’ job is the self-actualization thought process of how the customer wants to be perceived by others. A crucial learning from this qualitative study was recognizing not only the magnitude of functional factors that govern users’ transportation decisions, but also the emotional factors that can play a significant role in a user’s decision process.
In this study, identified ‘functional’ jobs include factors such as price, efficiency and vehicle size. Riders are oftentimes much more vocal and aware of these functional factors because they are the core tasks that have to be accomplished in their particular travel circumstance. For example, a common rider task might be to ensure arriving on time at a particular destination. In this study, a participant noted their responsibilities as a mother, where “the school bus arrives at 7:20am, so at 6:45am I will need to drive [my child] down the street to the babysitter, where he will wait and then board the school bus.” As the participant shared this particular occasion, she explained how the current travel arrangement is ideal for her work schedule, but it would be beyond her budget if she had to continue this arrangement due to the cost of the school bus. In that instance, she described the functional goal of minimizing the cost expenditure of their travel option to stay within bounds of their budget. In this case, due to the participant’s price constraints, she has to trade convenience and efficiency for price.
Efficiency is a key component of uberPOOL and through this study, the team is able to understand how riders talked about this important concept. Riders mentioned topics such as route planning, trip duration, amount of waiting time, and arrival time variability – all of which are aspects of efficiency in riders’ travel choices. For example, a rider said “the way I approach travel…I don’t know if this is unique but I always make sure that I know more than one route that I can take in case there’s traffic.” In this case, the rider is concerned about traffic affecting her trip duration and, therefore, paid more attention to route planning. One of this rider’s functional goals is to identify the best possible route to her destination, but ‘emotionally’ she is also trying to increase confidence in her overall travel plan by creating a secondary plan. As such, this illustrated to the team how efficiency trade-offs do not live in isolation but are interconnected with other factors.
Moreover, efficiency factors, such as trip duration, can be interpreted as actual or perceived. For example, a rider described using other sources of travel information. The rider mentioned that by entering the “time you want to be there, [the app] will say ‘traffic is usually heavy around this time.’ So if you leave at this time, this is how long it’s going to take you. So I use [the app] to let me know so I can leave far enough in advance.” This would be a case where a rider has actual time predictions that inform them on the efficiency of their trip. In other cases, a rider might believe that a particular route will take longer based on past experience. This terminology around efficiency added a new way to frame of how riders evaluate perceived vs actual efficiency differences in their travel choices.
In summary, riders make trade-offs on trip attributes across all three ‘functional,’ ‘emotional’ and ‘meaning-based’ dimensions. In Figure 4, a participant walks through how his job as a police officer is mostly urgent, unstructured and unplanned – namely that “nothing is the same every day.” With his varying destinations and schedule, the participant emphasized the need for a more time-efficient but spontaneous travel arrangement. Meanwhile, he also noted strict values against drinking and driving, concerns around DUI and the need for travel decisions to include how to “help keep people more safe.” This example illustrates how ‘functionally’ time-efficiency is key; ‘emotionally’ the user needs control, and “meaning” where it supports his personal values, which is on individual and community safety. Considered together, this frames a rider’s decision making model for travel choices.
Figure 5. A rider explains the functional, emotional, and meaning-based trade-offs through the travel-mapping exercise (Left). A mother refers to her child’s school schedule to guide her travel-mapping exercise (Right).
Understanding Trade-offs in the Context of uberPOOL
The research team recognized how riders’ travel decisions cut across functional, emotional and meaning-based dimensions. But as first step in building the perfect POOL, the team had to narrow down the list of factors they had more direct influence and control over, such as the matching intelligence and efficiency attributes of uberPOOL. To do so, they proposed first utilizing a maxdiff survey and then a conjoint survey. After launching early algorithmic changes, the team would return to additional qualitative research assessments for a holistic re-evaluation of the tradeoffs, including an assessment of how users’ functional, emotional and meaning-based dimensions interact across the product. Accordingly, the team strove to understand the intricacies of efficiency attributes and how they should manifest in uberPOOL’s matching algorithm.
This also means that emotional needs, such as safety or concerns in sharing a car with strangers, are important factors but given that these factors are less controllable from a product perspective and more on a policy perspective, the research team proposed first focusing on understanding factors that the team has more direct influence over and supplement future work on understanding these emotional needs. This work was conducted post-launch but will not be discussed in this paper.
The uberPool algorithm that matches multiple riders with a driver introduces uncertainties to both user groups. When riders request an uberPOOL, they are only provided the bare essential information such as upfront price, approximate time of the driver’s arrival, and an estimated time of arrival at their destination. Even though they are told that uberPOOL is a carpooling product, they cannot be certain whether additional riders will actually join them. Riders also do not know ahead of time, when, where, and with whom this sharing will happen. This is because matching decisions happen in real-time. Meaning that users are only provided that information after the decision has been made. Even after the original matching has been made, the result may entail picking up two additional riders, adding 10-minutes to the original rider’s on-trip time. Hence, part of the uberPOOL experience involves coping with these uncertainties around the types of inconveniences they will experience during their ride.
An important distinction discovered from the qualitative study is how riders might have control over the types of inefficiencies that they will experience, compared to unknown inconveniences embedded in an uberPOOL experience. For example, a rider driving in their own vehicle but stuck in traffic, will have more control on what route planning to take. However, in the case of an uberPOOL, these routing decisions are decided by Uber, not the rider. As such, the rider will also not know the route that is designed before selecting uberPOOL. Therefore, the qualitative study sought to capture the added nuance of ‘ownership’ and ‘transparency’ of what inconveniences to be experienced by riders.
Illustrative Example – Sarah is a teacher at a school in the Hunters Point neighborhood of San Francisco; she commutes from her home 1-hour away. On a particular day, she needs to carry some class equipment and get to school by 8am. She has a transportation budget of around $10 per trip. She wakes up at 6:30am, considers her options, and then decides whether to request an uberPOOL. The Uber team understands that riders like Sarah have to evaluate transportation options against set requirements. Evaluating uberPOOL against these factors can be challenging for riders because they are not privy to complete information about the experience ahead of time, such as how many riders they will share their ride with, how much added time the additional matches will add to their on-trip time, and the overall quality of the route that may also affect the time of arrival.
As a result, the team questioned whether communicating some of these inconveniences that were traditionally unknown to them might be valuable to riders’ decisions. For example, riders do not know ahead of time the number of additional riders joining the trip or know where the defined route will take them. The team asks whether these efficiency factors need to be communicated upfront to riders. However, providing such information would come at a cost to Uber and can only be justified if riders deem it valuable in their travel choice. Therefore, the team conducted a maxdiff survey to validate top factors that shape riders’ decisions on uberPOOL and whether certain efficiency factors, if communicated upfront, would significantly alter their travel choice.
MAXIMUM DIFFERENTIATION SURVEY (Maxdiff)
The in-home qualitative research with uberPOOL riders provided the research team with insights about key needs informing their existing transportation choices and what they considered the perfect POOL. In order to test and scale the interview findings, the next phase of research included two broad-based online surveys measuring the relative value of their choices. The following section defines the first of the surveys – a maximum differentiation (“maxdiff”) analysis – and discusses its design, results and impact on the perfect POOL.
Moving to an online survey allowed the researchers to overcome some common issues found in small sample sized interview methods, namely selection bias (Collier & Mahoney 1996). Interviewers often encounter selection bias in their panelists due to geographic, behavioral, and economic factors. The lower commitment costs of an online survey somewhat mitigate selection bias due to less demand on respondents’ time. Employing a survey was also beneficial due to stratified sampling & survey quota capabilities, which allow for a more representative rider population than small-n studies. This ensured a rough approximation of the underlying population (Qualtrics Quotas). The survey send was stratified by rider tenure, city, & product mix (uberX and uberPOOL usage) to ensure that the overall results were reflective of the target market and that the data could be segmented by these rider dimensions.2
Understanding Rider Preferences
A non-trivial issue when studying consumer preferences is creating meaningful separations across various product characteristics. Researchers that ask survey respondents to stack-rank desirable product attributes may get only minimal differentiation in the resulting dataset (Epstein 2018). These stack-ranked questions are often coded with ordinal values, and, in many cases, the mean value across all respondents is reported as the primary summary statistic (Lovelace & Brickman 2013). Typically the stacked-rank approach results in point estimates with overlapping confidence intervals. As such,there is no statistically significant difference between the estimates. Hence, these figures often have little difference in value, and, with the exception of extreme outliers, provide little incremental insight to the researcher.
For this study a maxdiff survey was implemented as a better approach to derive the underlying value of each product feature. A maxdiff forces respondents to choose the option they like most and least out of a larger set of answer choices. Even if a respondent values two items nearly identically, a maxdiff will force them to think critically about the pair and order one over another by preference. This encourages differences to emerge that might not be possible with the simple ranked-choice method. The resulting dataset forms the basis of the maxdiff analysis. Running a logistic regression on a transformed version of this dataset will provide coefficient values that can then be rescaled and used to gain insights around what consumers care about most and least (Hess 2014).
There are no strict rules when designing a maxdiff survey, as both the number of answer choices and question sets used in the survey can vary. Best practices in research design dictate that a maxdiff should minimize the number of questions, have answer choices appear at least three times, and ensure that each answer choice is shown to the respondent an equal number of times (Porter & Weitzer 2004, Sawtooth Software 2013). Following this approach minimizes the survey fatigue of respondents and increases the overall survey completion rate.
In designing the maxdiff survey, the research team limited the set of product attributes to those gained from the qualitative research. Some attributes were removed from the maxdiff due to the lack of actionability given the existing marketplace; these included car type and number of co-riders. Other attributes like price were eliminated from the survey because they were already selected for inclusion in the follow up conjoint analysis survey due to their immense importance.
The maxdiff survey consisted of a six question-balanced incomplete block design, with four-answer options where each choice appeared exactly three times in the research design (Graham & Cable, 2001).3 An incomplete block design (IBD) is an experimental framework used when it is not possible to include all treatments (product features) in every block (survey question). IBD may be necessary due to financial, labor, or cognitive limitations on the survey respondent or organization conducting the study. Uber researchers chose an IBD in order to facilitate the forced trade-offs between subsets of product features in a balanced way.
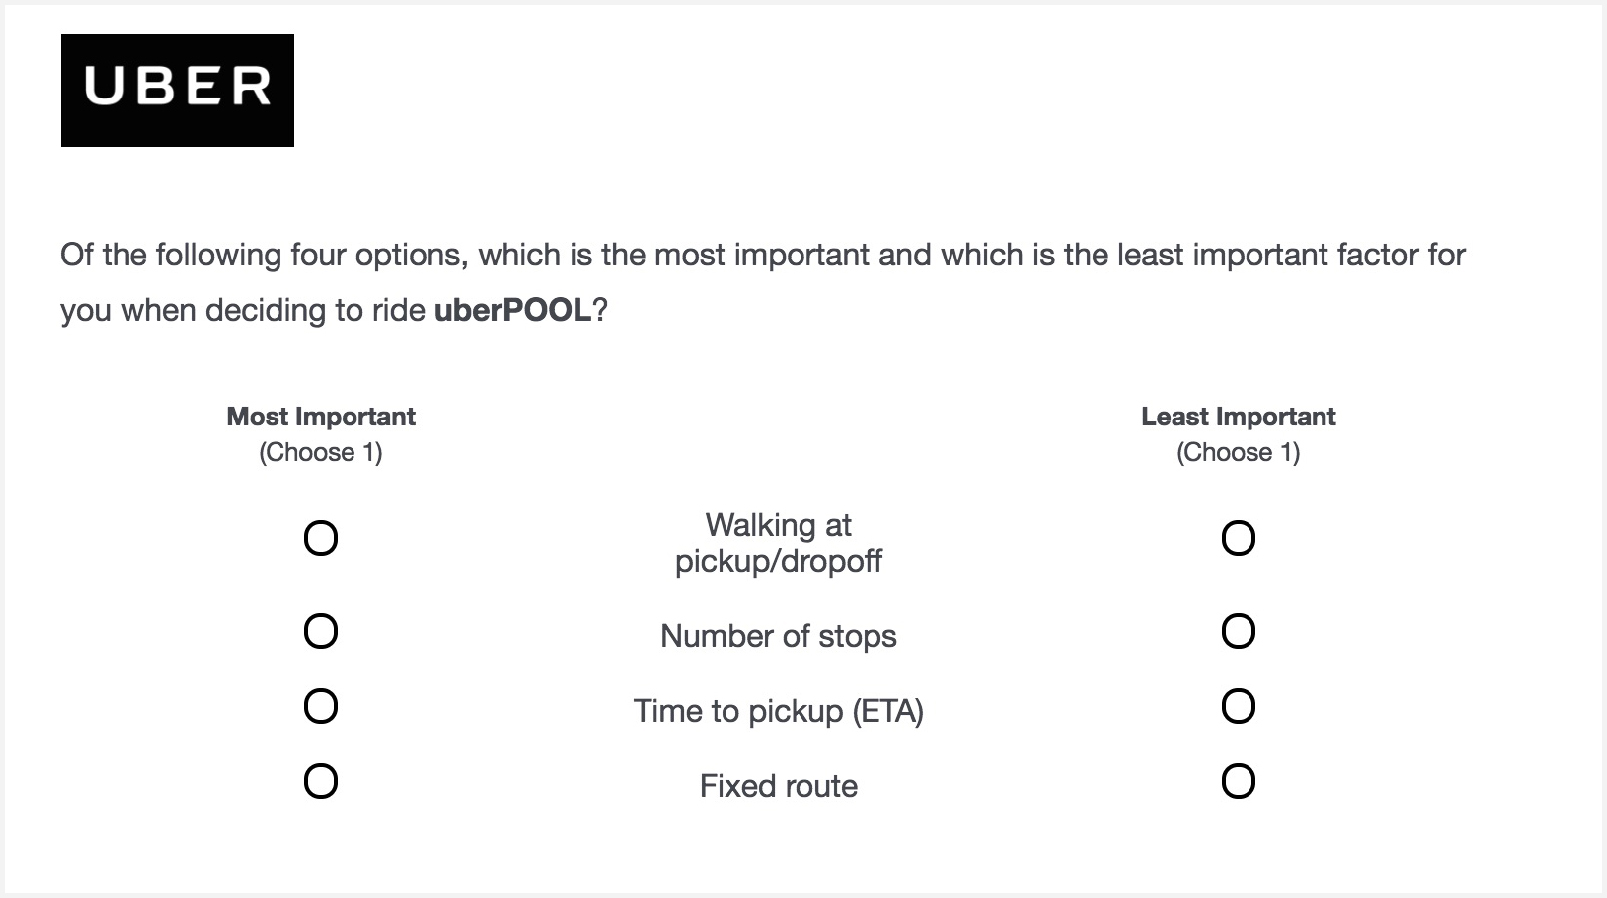
All of the maxdiff questions were constructed in the same fashion, with each question asking the respondent, “Of the following four options, which is the most important and which is the least important factor for you when deciding to ride uberPOOL?” Of the four answer choices, respondents are required to select one option that is the most important and one that is the least important when considering whether or not to use the uberPOOL product. Figure 6 shows a sample question used by the Uber research team in the maxdiff survey.
Figure 6. Example maximum differentiation survey question
The researchers implemented the maxdiff survey on the Qualtrics survey platform. They randomized both the order of the questions and the answer choices within each question, using this functionality to minimize bias introduced through survey respondents who use simplification strategies, such as selecting the first answer choice for every question (Qualtrics Question Randomization). In addition to the maxdiff questions, researchers also asked about respondents’ current uberPOOL usage, commuting habits, as well as open-ended questions around their existing transportation options and future needs.
The survey was sent to Uber riders who took an uberPOOL trip in the 30 days prior to the survey send in the metropolitan regions of Boston, Washington DC, New York City, Chicago, and the San Francisco Bay Area. These markets were selected due to the high prevalence of uberPOOL usage and the density of Uber trips. As such, these geographies made ideal product launch markets and were a natural choice to use for the survey audience. Five-thousand, 30-day active uberPOOL riders from each market were selected at random to receive the survey by email, resulting in 3,000 completed surveys (for a completion rate of approximately 12%). Conditional upon finishing the survey, the mean-time to completion was 22-minutes and the median was 5-minutes.
Logistic Regression
By assuming that riders maximize their utility when answering questions, researchers are able to use discrete choice models, such as logistic regression, to estimate the value of each product feature (Hosmer & Lemeshow, 2010).4 The logistic regression model can be described by the following equation:
The equation gives us the probability of a specific product feature (Y) being selected by a survey respondent (i) conditional upon specific covariates values (X). This is equal to the inverse logit function of the product between respondent i’s covariates and the coefficient values (β) of each variable (Marley & Pihlens, 2012). The logistic function, or the natural logarithm of the odds, takes any real number input and outputs a value between zero and one. It is a particularly useful tool when computing the probability that an event occurs.
The raw Qualtrics survey data needed to be reconstructed to be used in a logistic regression model.5 The independent variables in the equation are dummy variables representing each answer choice in the research design and are coded “1” if the respondent thinks the answer choice is best and as “-1” if it was worst. The coefficient values from the fitted logistic regression can then be directly compared – or normalized – to estimate the relative preference of each answer choice (Marley 2018).6
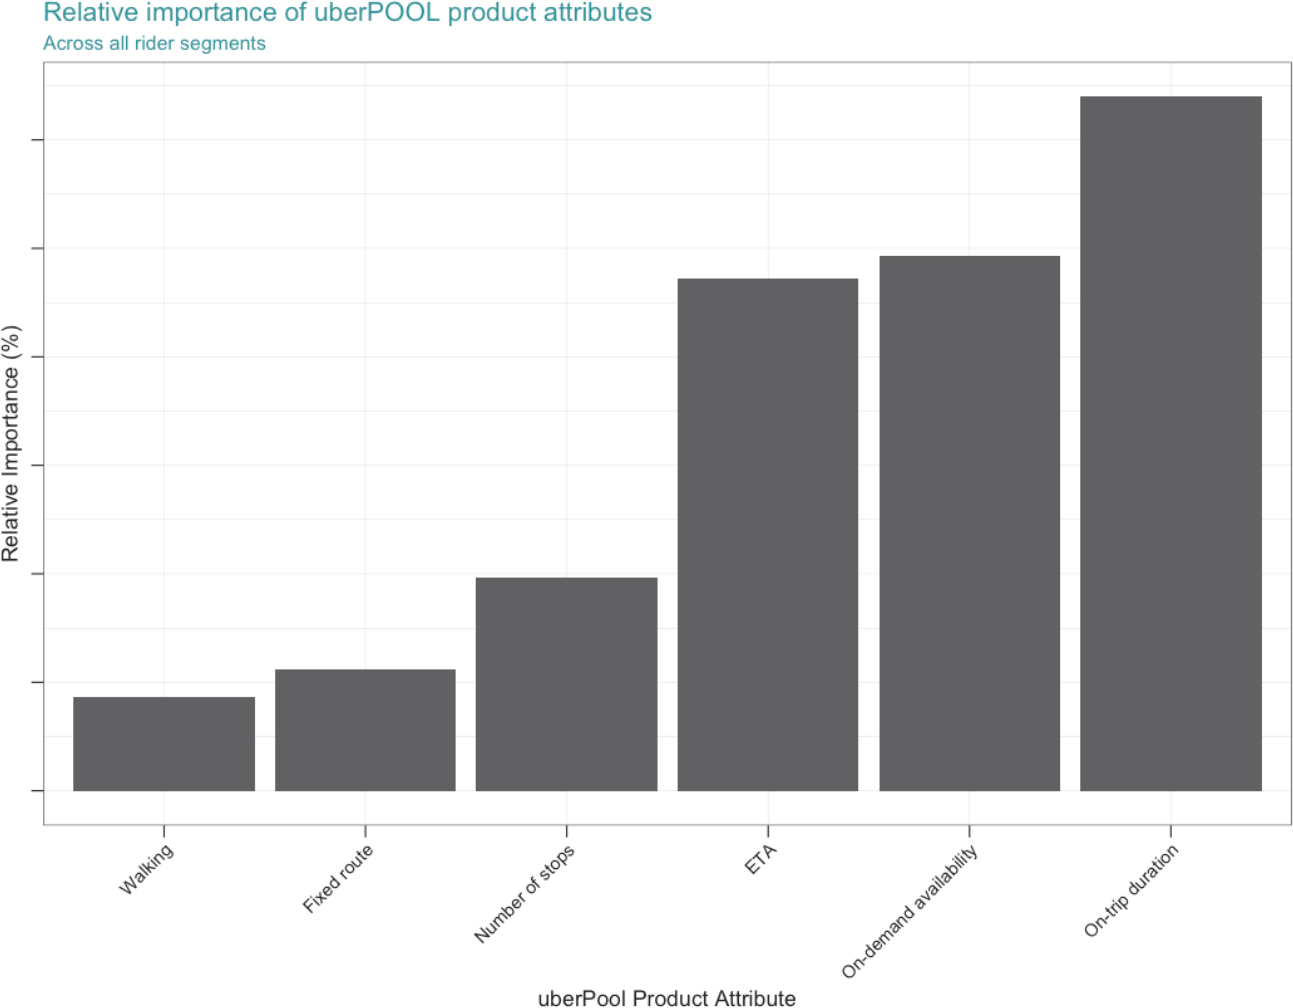
The main findings from the analysis indicate on-trip duration to be riders’ most important product attribute when deciding whether to use uberPOOL; duration was followed by the estimated time to arrival (ETA) and on-demand availability of Ubers. Last came fixed routes, number of stops on trip, and finally walking to and from the pickup/dropoff location.
The most important factor – that riders care most about efficiency – corroborated the insights from the interviews. Specifically the maxdiff showed walking to be riders’ least important attribute when deciding to use Uber. Walking is also the least expensive feature to implement within our existing matching & routing algorithm. Coupled with the being able to coalesce riders’ pickup locations together means that Uber would be able to provide the greatest possible gains in efficiency with the lowest amount of additional inconvenience to the rider.
Another important insight for the research team was that having a fixed route, or limiting the number of stops, was a relatively unimportant product feature to consumers. This complemented the qualitative research that identified poor quality routing as a factor stunting future uberPOOL adoption. Just because riders view trip-routing as a issue doesn’t mean they believe that having a fixed-route is the solution. This fixed-route insight allowed the team to shift gears and focus on alternative product features that would be less expensive on Uber’s dispatch-matching algorithm and result in a more enjoyable experience for our riders. In short the maxdiff results gave the team a better understanding of what product features constitute the perfect pool.
Figure 7. This plot shows the relative difference in the importance of feature utilities, as derived from the maxdiff analysis. Exact percentages have been abstracted to protect business insights, but all the features in the plot add to 100%.
CONJOINT ANALYSIS
The qualitative interviews gave insights to which features riders wanted in an improved uberPOOL product and the maxdiff found which of these features they considered the most important. The next step to understand the perfect pool was to determine what values each of these features should take on. For example, the maxdiff identified walking as an important feature but researchers needed to understand how much walking riders actually find acceptable. To unlock these insights, researchers turned to a conjoint analysis as their methodological tool.
A conjoint analysis is a survey based method used by market researchers to determine how people value different attributes that make up a whole product or service. They can then use these insights to create new products or tweak existing ones to increase market share or optimize profits.7 Like the maxdiff technique, the conjoint analysis is composed of forced choice questions that researchers analyze using statistical models to determine the underlying value of these product features (Hess 2014).
Conjoint survey questions give respondents a variety of hypothetical products and asks them to choose the option they would be most likely purchase in real life.8 Each hypothetical product is made up of a bundle of attributes and the value, or level, of each attribute varies randomly from question to question. Conjoint questions will typically include an opt-out option for respondents to more accurately mimic a purchasing situation, where a consumer always has the choice to walk away. Having a “none” option is important because it allows researchers to understand the baseline threshold at which people are willing to buy something. For the uberPOOL study, this threshold corresponds to the baseline utility a rider gets from continuing to use their existing commute option. Riders will only alter their commute when they derive more value from hypothetical uberPOOL product than do they from their status quo situation (personal vehicle, trains, buses, etc). By having the product bundles change randomly from question to question, researchers are able to estimate the value of any individual product feature-level, the interaction effects that may exist between various attributes, and their opt-out threshold.9
Good conjoint questions mimic the purchasing decision process as closely as possible, with the respondent having clear context for the choices being made. Conjoints can suffer from a variety of biases, and a good survey design should try and mitigate them using concise and clear questions to avoid cognitive overload on the respondent. These biases can be introduced by questions that are too mentally taxing, suboptimally formatted, or lacking enough “skin-in-the-game” to feel like real simulated purchasing decisions. This may cause respondents to resort to satisficing strategies, which may result in poor quality data (Rossi & Allenby 2009). If these obstacles are overcome, then a well-constructed survey allows researchers to create an artificial marketplace where they can predict a new product’s performance relative to market competitors and other status quo options, as well as give insights regarding a company’s potential cannibalization of existing products.
Creating Testable uberPool Scenarios
The goal of the Uber research team was to create a conjoint that uncovers what constitutes the perfect pool while avoiding the common pitfalls and biases of conjoint surveys. To this end the conjoint developed by the team was more sophisticated than a typical static design, and the questions dynamically changed based on user inputs to create a fully customized survey that closely relates to their existing commuting experience.
Table 1. Conjoint Features and Levels – Research Design Matrix
| Feature | Level 1 | Level 2 | Level 3 | Level 4 | Level 5 |
|---|---|---|---|---|---|
| Estimated time of arrival | Request now and wait 5 mins | Request now and wait 10 mins | Book 15 mins ahead | Book 30 mins ahead | |
| Walking | No walking | Walk 1-block | Walk 2-3 blocks | ||
| Trip length multiplier | 1x | 1.1x | 1.2x | 1.3x | 1.4x |
| Trip variance multiplier | 1.1x | 1.2x | 1.3x | ||
| Discount multiplier | Very low | Low | Medium | High | Very high |
Table 1 gives the final product attributes and levels selected for study by the research team. Some of the variables were chosen because they were the three highest valued product features discovered in the maxdiff study: time to destination, on-demand availability, and estimated time of arrival of the driver to pick-up the rider (ETA). In addition to these variables, the Uber research team included a price discount relative to UberX in order to recreate a purchasing experience with the same information available to riders in-app.
The team chose to use a fully randomized research design for the conjoint survey. This design resulted in every possible combination of product feature-levels, resulting in 900 potential product packages for use in the survey.10 By opting to not have any restrictions on product combinations that may be deemed unrealistic, researchers were able to study both the value of each individual product feature-level as well as estimate interactions among them without violating independence assumptions that would cause the team to systematically over or under predict the importance of model estimates. To maximize the number of profiles considered by respondents while minimizing survey fatigue, the team choose to include 7-conjoint questions in the survey and gave respondents three choices for per question, with two of the choices coming from the 900 possible product packages and the other being an opt-out option.. No assumptions were made about respondents’ default commuting option and could be anything; including personal vehicle, train, light rail, bus, uberX, other rideshare products, walking, scooting, a combination of these or none of the above.
The survey was implemented in Qualtrics and made use of a backend server to run the experimental product package randomization and create custom on-trip time to destination & pricing estimates for respondents. Question templates coded to accept variables from the server were used to provide programmable questions that could request server data with the web service functionality in Qualtrics (Web Service – Qualtrics Support).
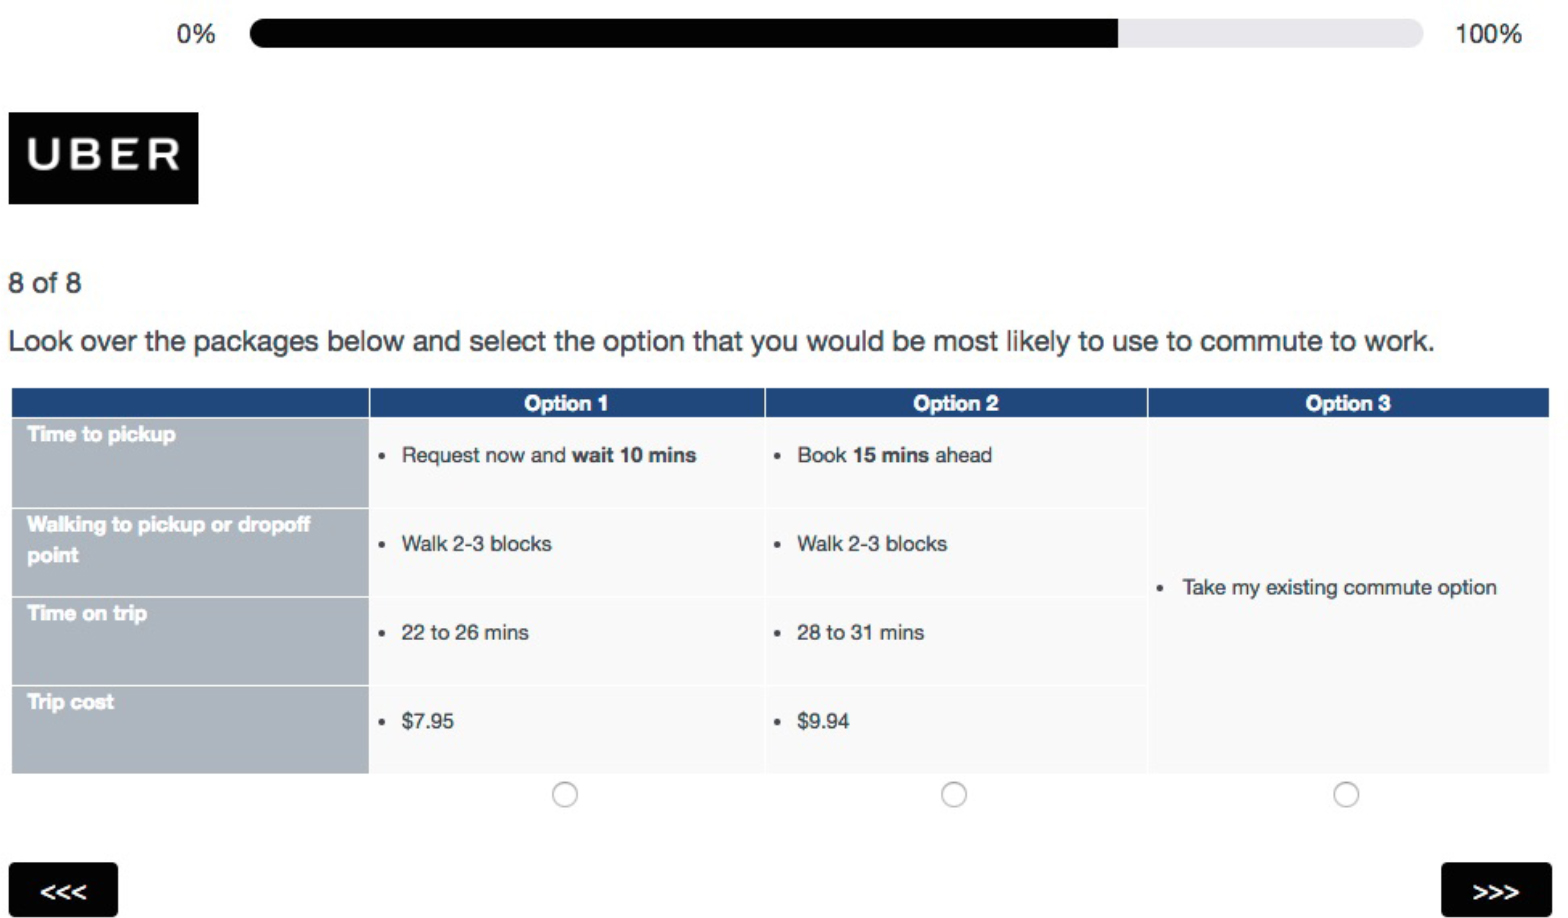
The conjoint questions differed from the verbatim values found on table 1, which took the form of a customized trip itinerary containing the same set of information that riders see in the Uber app when confirming a pickup for a trip. This information includes an upper and lower bound for the estimated time on-trip, the upfront price of the trip, the amount of walking to get picked up, and the estimated time of arrival of the driver. These custom estimates were configured by asking the survey respondents how long it takes them on average to drive door to door from home to work during their commute hours. An example question as rendered to a respondent can be seen in Figure 8.
Figure 8. Example conjoint question.
Self-reported home-to-work driving time estimates were sent to the server where the product packages were randomly chosen. Each rider was randomly assigned 14 different product packages from the 900 total options;11 these 14 profiles were then randomly paired together to create the question sets for each respondent. After selecting the product profiles, the attribute-levels were translated into an estimated driving time and price for an UberX trip, after which the discount multiplier associated with the package was applied to the UberX price and reported as the cost of the uberPOOL trip. The lower bound of the on-trip time to destination was calculated by taking the estimated door-to-door driving time and applying the trip length multiplier to that estimate, then configuring the upper bound by applying the trip variance multiplier to the lower bound.12 The extra effort involved creating these customized conjoint questions helped contextualize the purchasing decision for survey respondents, thus giving researchers higher confidence that the insights from the study are valid and bringing the picture of the perfect pool into greater focus.
The research team conducted multiple rounds of user-testing on the conjoint survey itself to get feedback regarding the ease of comprehension and cognitive overhead. After ensuring that the survey was easily comprehensible by respondents it was sent out to 18,000 riders via email on August 3, 2017, resulting in a total of 1,934 completed surveys and yielding an overall email response rate of 10.7%. The median time to finish the entire survey was 5.5 minutes. Respondents were incentivized to complete it with an opportunity to win one of five $500 Amazon gift cards.
Estimating Feature Utilities
The goal of a conjoint analysis is to obtain the value associated with each feature level. As in the maxdiff analysis, the Uber researcher team assumed that survey respondents choose the hypothetical product package that maximizes their utility. As a result, the part-worth estimates can be seen to represent the value associated with each feature by riders (Rossi & Allenby 2009). Part-worth estimates enables the researcher to compare unrelated features on a common scale and gain insights that would not be possible using purely qualitative approaches. For instance, in the interviews riders indicated that walking and time on trip to destination were both very important to their purchasing decision – yet the conjoint part-worth estimates allowed researchers to precisely quantify the relative worth of these features against each other, or put them directly into a dollar value.
The utilities in this case study were estimated using a hierarchical bayesian multinomial logistic regression. Hierarchical refers to the model estimating utility values at the individual respondent level that can then be aggregated to obtain an overall result, rather than just estimating the aggregate level coefficients for all respondents. This property is useful because it allows for the creation of a mini-marketplace where each person has heterogeneous preferences (Rossi & Allenby 2009). This diversity of opinion can be directly modelled and used to gain deeper understanding for how people interact with the Uber app. Bayesian multinomial logistic regression is a generalized version of the logistic regression covered in the maximum differentiation section that is estimated via simulations for generalized choice data (Rossi 2017).13,14
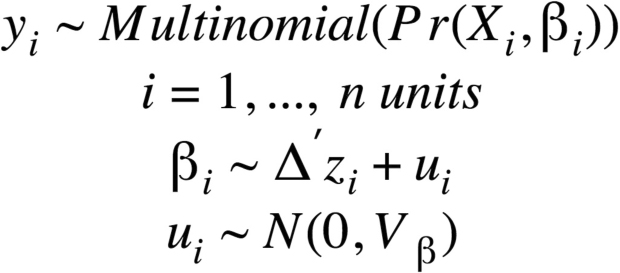
The model was estimated using the bayesm package in the R programming language (Rossi & Allenby 2009).15 The model can be described by the following specification:
Where the probability of choosing product y for respondent i is distributed multinomially as a function of covariates Xi and βi. The part-worth estimates (βi) are distributed logit parameters over respondent units with mean , with being a matrix containing mean-centered control variables for each respondent, with errors (ui) that are normally distributed with variance Vβ (Rossi & Allenby 2009). The posterior distribution of βi is used to determine the overall utility of each product feature and is the main quantity of interest of the analysis. Researchers used the model’s log-likelihood as a measure of goodness of fit, which converged successfully after 100,000 simulations.16,17
Control variables used in the analysis include historic Uber usage data, such as the home city of the respondent, rider tenure in days since signing up for an account, lifetime billings, as well as survey-based variables such as the time it took a respondent to complete the survey and demographic information. No other behavioral features were used in the analysis, per Uber’s policy of respecting the privacy of user data (Privacy Policy – Uber).
Conjoint Results
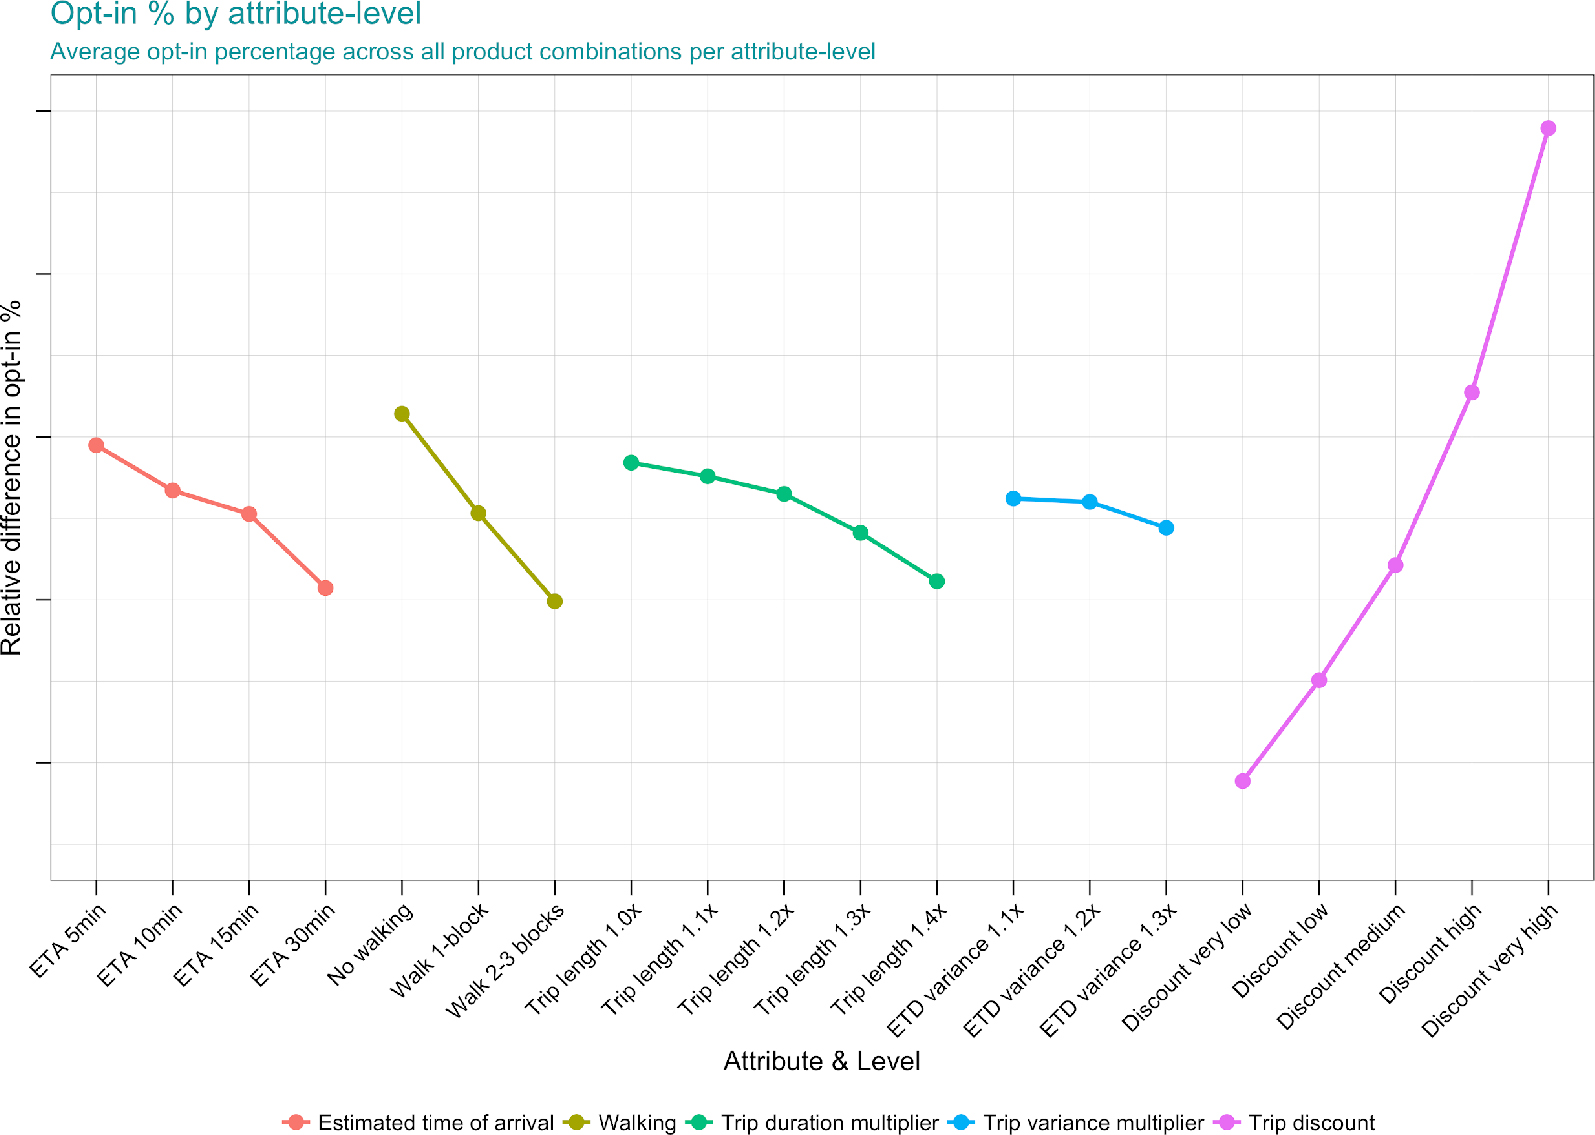
Figure 9 shows the expected opt-in rates for feature-levels based on the part-worth utility estimates for each product-feature. Hypothetical products are constructed by selecting a level from within each product attribute and calculating the sum of the part-worth utility estimates. These packages can then be compared against the “none” option that represents the baseline utility a respondent gets from their status quo commute option. Researchers can then construct a simulated marketplace where riders make discrete choices between choosing a new product or not based on this calculus. In practice, the performance of new products within this discrete choice framework are best taken as directional rather than an indication of actual opt-in rates if the product were developed and launched to the public.
Studying the slope of each attribute as levels increases gives powerful insights to the relative worth of each feature to consumers. Unsurprisingly researchers found that price was the most important attribute, with steeper discounts of the uberPOOL product providing positive utility to respondents. All other features represent some degree of inconvenience to the rider and as such have negative utility, with trip variance having the smallest negative impact and walking the largest. The non-linear relationship in ETA utility provided valuable insights regarding respondents’ preferences towards waiting longer for a trip, with breaks after 5 and 30 minutes ETAs. This implied a clear need for continuing with an on-demand ridesharing product, while also indicating that riders have an ETA threshold after which their utility decreases substantially. This provided evidence that Uber could increase the efficiency of POOL by making riders wait longer upfront for a larger discount on the trip. The improved efficiency of matching riders with others also results in decreased on-trip duration through improved routes leaving riders and drivers better off.
Figure 9. Conjoint results – Overall POOL opt-in by product feature-levels. This plot shows the relative difference in opt-in for each product feature-level, holding all other features constant. Exact percentages have been abstracted to protect business insights.
Segmenting respondents by their commute characteristics and tenure on Uber allowed for more granular insights. Tenured riders that signed up 2+ years ago are more discerning consumers, and are less likely to opt-in than new riders, while newer riders are more price-sensitive with larger increases in utility coming from higher discounts. Segmenting opt-in rates relative to a rider’s commute shows that shorter commutes make you more likely to opt in but also more sensitive to walking than riders with a longer commute. These segmented insights provide the framework for creating tailored products that best suite the needs of different market segments.
BUILDING THE PERFECT POOL
This multi-phase research study utilized both qualitative and quantitative methods in building out incremental knowledge towards understanding and building the perfect POOL. Starting with the in-depth qualitative research, the team’s approach towards rider trade-offs became more advanced and precise in terms of understanding, implementation and communication. This section outlines the main takeaways from each research phase, and how the team stayed true to rider preferences during product implementation.
Validating Product Concept
The qualitative and quantitative research demonstrated that riders can and will make trade-offs between the inconveniences and benefits of uberPOOL. Riders will accept certain levels of inconvenience such as extended trip length, trip variability, waiting, and walking in return for a lower price and a more direct route. This is because these factors are not foreign concepts and are common across rider’s existing travel experience. For example, riders might already walk a few blocks when ordering an Uber for a more convenient pickup. Since aspects of this were already evidence on Uber and other transportation services, the concept was not a far departure from rider’s current reality. Therefore, the crucial takeaway was in defining what rider’s might expect as an acceptable price in order for them to accept such inconveniences.
Originally, the team was concerned that riders would not be willing to make upfront trade-offs for an improved on-trip experience, such as having a more direct route, but this was not the case. Research demonstrated that some riders do weigh upfront costs, such as effort in pre-planning, to ensure that they have a more ideal travel experience. The team was able to further validate this take-away, showing riders stated preference to wait and walk for a lower price and a faster trip.
The conjoint helped confirm that users find the new value proposition compelling. This confidence was crucial to help align the team on the concept that it was worthwhile to undergo such a massive engineering effort to change the existing uberPOOL product. The mixed-method research approach also provided the team in-person experience with riders, understanding how existing and potential users might perceive the concept. Overall, this grounded team members on the most likely product challenges and helped capture and address concerns of user adoption.
Forming the Narrative on Affordability
The conjoint demonstrated that rider utility increases with lower cost more quickly than disutility increases with inconvenience. Unsurprisingly, it showed how lower price is one of the most important benefits. This was a key strategic piece of evidence for prioritizing the lowest possible cost with uberPOOL that the team was mandated to own and lead efforts towards affordability, driving down price through innovative efficiency solutions.
This evidence not only helped the team identify the significance of price discounts in driving opt-in, but also helped put the magnitude of this business goal into perspective. The conjoint was used repeatedly during offsites, vision exercises, and planning sessions to demonstrate the ideal level of price discounts that the team needed to accomplish. This provided an early signal inspiring the team on the potential growth that could be unlocked. This excitement was shared across various Rider teams, product orgs, and executives on the future of uberPOOL, establishing buy-in and alignment from across the company.
This research demonstrated the power of lower prices, which led the team to put affordability front and center in marketing the product. The team utilized this learning to create a series of marketing claim tests to identify the best messaging. The theme of affordability proved to resonate the most with customers, and the team iterated on numerous concepts to help emphasize this benefit. As such, Express POOL was launched with the focus on savings with the final product tagline ‘walk a little, save a lot’ to communicate the slight trade-off as evidenced through our research. Media outlets described it as “Uber Express Pool offers the cheapest fares yet in exchange for a little walking.” (Hawkins, 2018)
Pricing Decisions
The team was able utilize the conjoint estimates on product opt-in to set realistic, rider-driven pricing and product targets during the development phase and beyond. The team used the conjoint to ‘simulate’ different configurations of waiting and walking and identified what was an acceptable price point to offset the additional inconvenience.. The team utilized these findings to sanity check pricing to ensure they were not offering an unbalanced product-market fit. For example, with certain levels of walking and waiting, the team utilized the conjoint to get a rider’s perspective whether prices would need to go up or down to get a more compelling Express POOL opt-in.
Prior to conducting this research, walking and waiting were previously discussed mostly through the lens of how it affects Uber’s ecosystem. Experiential concerns and user metrics, such as opt-in or user feedback, were often delayed inputs measured after product launch. With this new approach the team was able to include users’ preferences when setting prices and product parameters Therefore, the conjoint provided estimated rider elasticities that enabled the team to configure the initial launch of the product while also informing subsequent experimentation. With this input, the team was able to discuss product parameters and prices with a more balanced and user-centered approach.
Non-Walking Option
Through this research, the team acquired a nuanced understanding on walking as a trade-off. Segmentation analysis on the conjoint results validated the team’s hypotheses that riders have varying sensitivities around walking and waiting, which are influenced by travel conditions and alternatives. As such, walking is not considered uniformly at the same cost across all riders. Rather, its importance fluctuates depending on the rider and the context. The uberPOOL product team recognizes that walking is one of the biggest parameters to balance, because it can provide meaningful efficiency gains to the product experience, but needs to be considerate towards riders with varying walking capability and desires.
This insight around walking ability influenced the team on uberPOOL’s product strategy and decision to maintain a non-walking option available to riders at launch. The team identified a subset of riders for whom walking was a great burden and the qualitative research showed the importance of having riders who are motivated to walk and wait, but also able to complete the walking task. Both research inputs identified how divisive walking can be for users, and as a result, the product team believed it was critical to maintain a non-walking shared rides option at product launch.
Translating Conjoint trade-offs into the Product Experience
The team wanted to be faithful to the survey method and translate the trade-offs into the product experience. In a conjoint survey, trade-offs are explicitly described in textual format. However, it is challenging when translating this trade-off into a product experience. As such, the product and design team iterated on numerous ways to communicate the walking and waiting trade-offs throughout the product design.
In terms of walking distance, the conjoint survey utilized a ‘blockwise’ terminology to indicate the amount of walking that the rider might be expected to do. The respondent was presented choices of ‘walk 1 block,’ ‘walk 2-3 blocks,’ or ‘no walking’ in the conjoint survey. However, the product and engineering team believed that engineering requirements to visually create and communicate such specificity was rather complex. As a result, designers brainstormed on numerous versions and went through rounds of usability testing for potential designs to communicate walking.
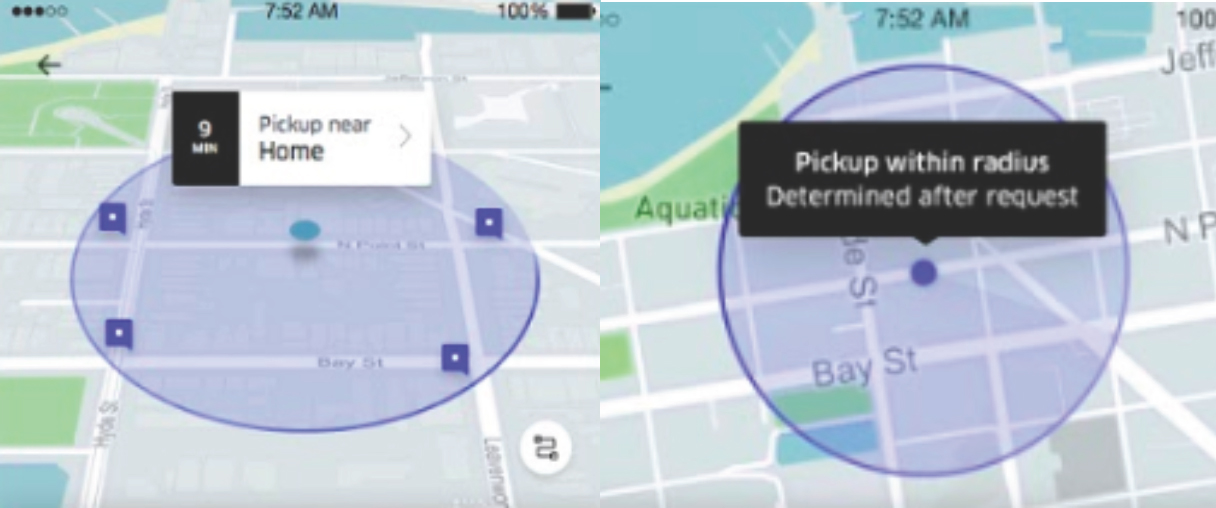
An important consideration in going through this design process is assessing the ‘specificity’ and ‘usefulness’ that the product and engineering team is able to provide for riders. A circular radius, as depicted below in several design explorations, aimed to communicate the potential walking radius with the potential pickup points to meet their driver. These designs portrayed the spatial area of walking for the rider, did not prove to be useful when selecting their product. In many cases, riders perceived the walking trade-off to be much larger than reality or misinterpreted information about pickup locations.
Figure 10. Sample design explorations to communicate spatial trade-offs for walking.
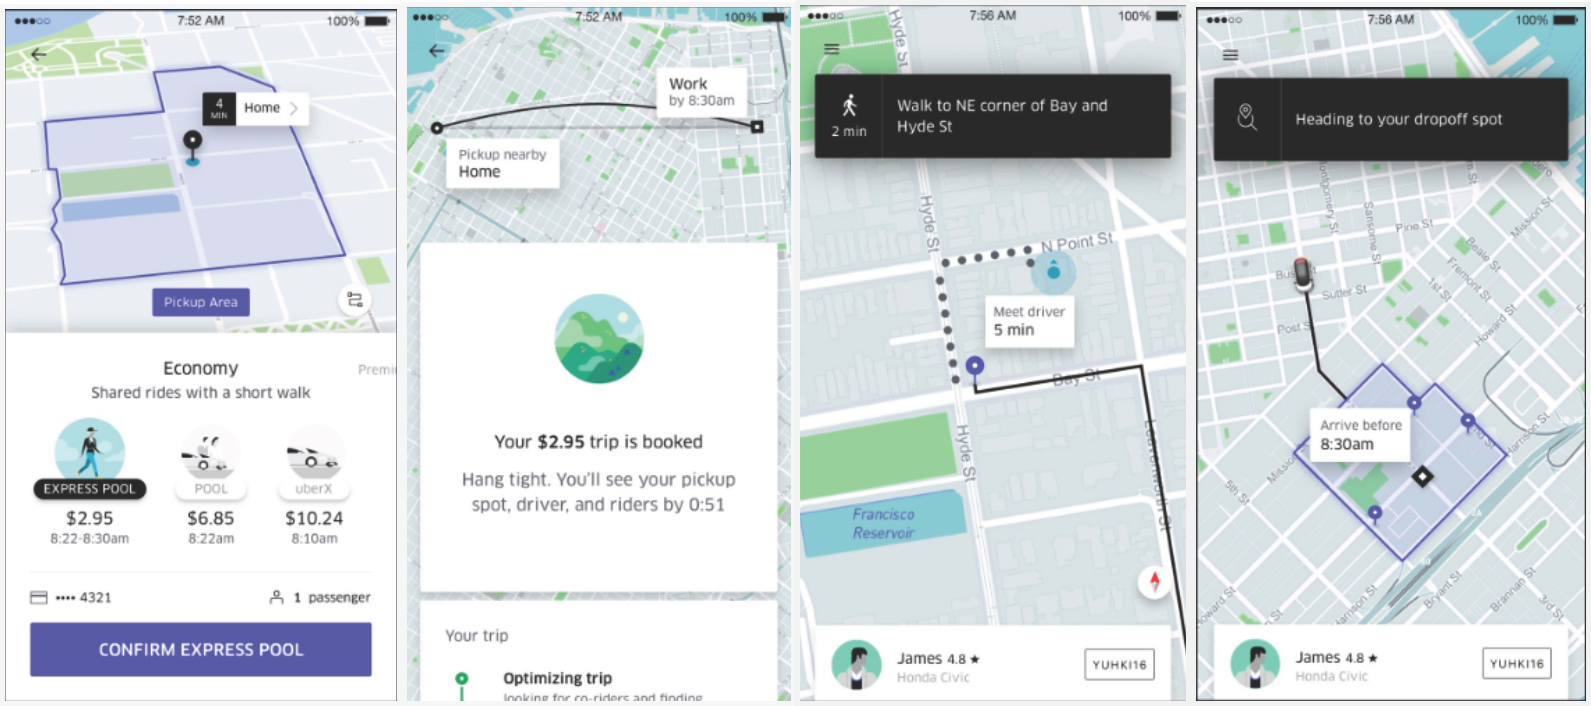
Designers and engineers ideated and created a more engineering complex approach, but believed in investing to better communicate spatial trade-offs for users. The team believed that walking, a critical piece of the user experience, should be useful in helping riders make their trade-offs. As such, the team finalized on a ‘bounding box’ design that best illustrated the realistic spatial trade-offs for a rider, that received great results from usability tests and after product launch.
Figure 11. End-to-end Designs of Express POOL – Uber’s new shared ride experience with walking and waiting. Designs as of Nov 2017.
Product Impact and Business Outcomes
The research team launched the Express POOL product on November 6th 2017 in San Francisco California and Boston Massachusetts. The rollout of the Express POOL product was spearheaded by Uber’s Shared Rides product team in San Francisco and augmented by local operations specialists. A minority of riders in these markets initially qualified to take Express POOL, but after checking the metrics to validate that the product was delivering against expectations it was rolled out to all riders. The product validation was based on the assumption that Uber could improve the uberPOOL experience for riders, drivers, and the company.
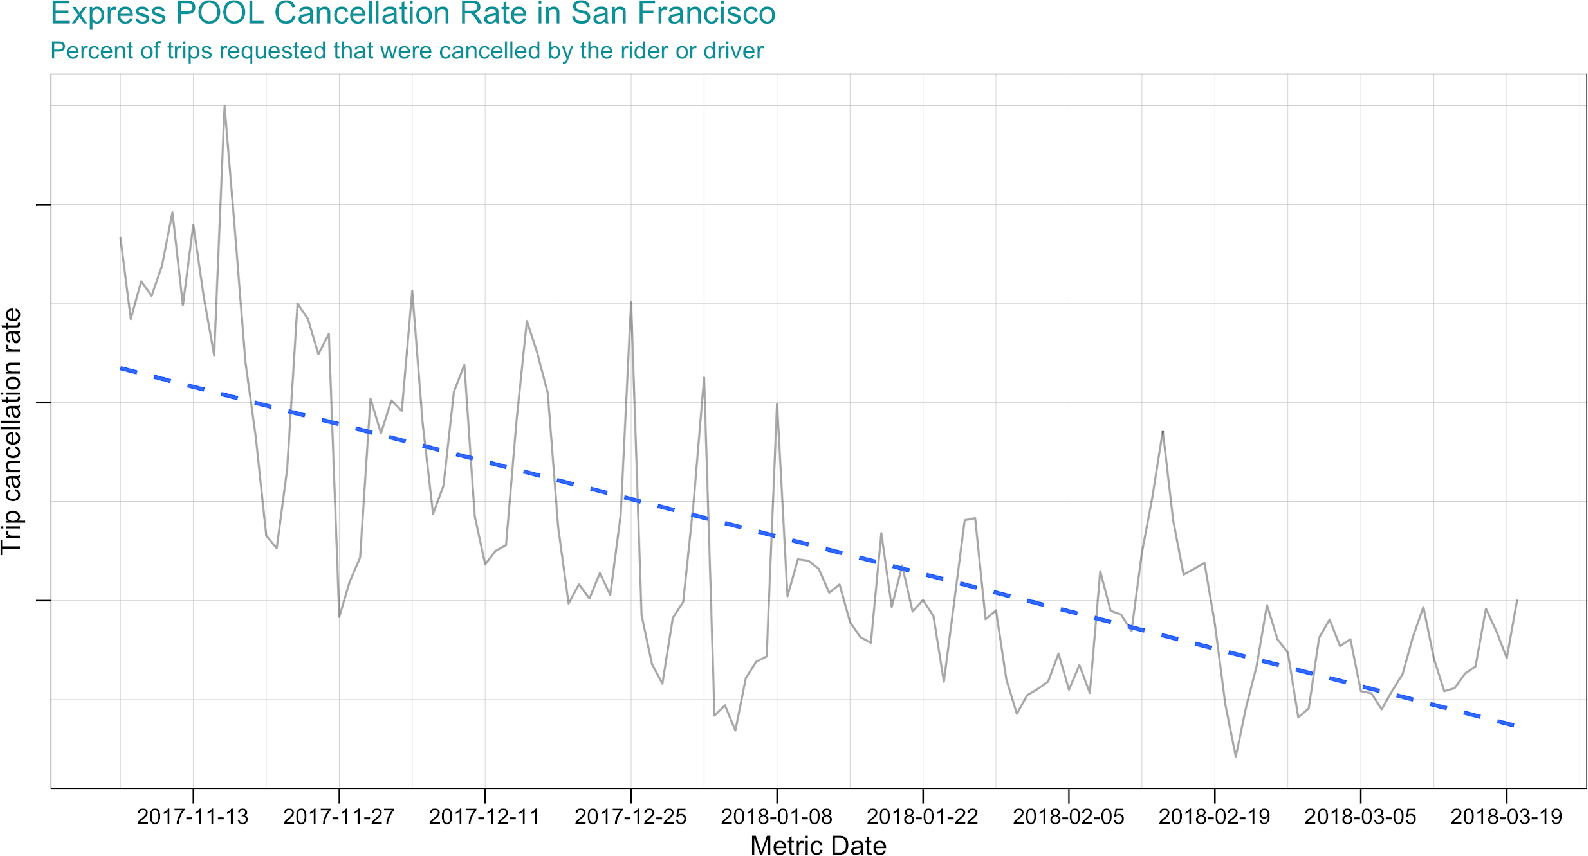
The team used trip cancellation rate as one of the many key performance indicators to determine the success of the Express POOL product launch. Trip cancellation rate is defined as the percent of trip requests made by the rider or driver that was cancelled before the driver arrived at the pickup location to start the trip. The metric is experiential, with clear associations between a lower rate and a better rider experience. Other important metrics studied at the product launch include Express POOL opt-in shared-rides rate, driver efficiency & earnings, rider inconvenience, rider earnings, support ticket rate, and more.
Figure 12 shows the Express POOL cancellation rate from the launch of the product in early November 2017 through mid-March 2018. The plot shows that in the period immediately after the launch both riders and drivers had relatively high cancellation rates, but the rates came down significantly as they adjusted to the new experience. A high cancellation rate is expected for new product launches, but is typically following by a decrease as people come up a learning curve of varying steepness. Even though the changes made to the Express POOL product request flow were substantial the team began to see a decline in cancellation rate two-weeks after launching.
Figure 12. Express POOL Cancellation Rate
The improved rider experience, supported by a falling cancellation rate, may be due to a variety of factors. High cancellation rates may be a symptom of curious riders exploring the new product in their app, and then make a trip request purely to investigate the new experience. These cancelled trip requests naturally decay over time as the novelty factor on the product begins to wear off post-launch. Riders may also gain a better understanding of the mechanisms of Express POOL and decide not to cancel due to uncertainty when waiting for a driver match, apprehension about walking to the pickup-location, safety concerns, or another issue. In sum there are many factors that might drive the falling cancellation rate, but overall it is indicative of good product-market fit and having improved the existing uber POOL experience.
The new product was also able to drive value to Uber’s bottomline. In the first month after launch riders that requested an Express POOL only waited for 40-seconds longer on average than riders taking the original POOL option. This 40-second delay was intentional, as Uber made riders wait on the trip request screen to get batched with other riders on their trip. In return for this delay, the match rate for the Express POOL product was 3.6% higher relative to the existing POOL product. Match rate is defined as the total trip requests that were matched divided by the total number of outstanding trip requests; it is a leading indicator of business performance and product experience. The improved experience associated with an increased match rate translated to riders taking 4.6% incremental shared rides trips 1-month after launch.
The success of the November 2017 launch of Express POOL in San Francisco and Boston lead to the product being rolled out in many other domestic and international markets. In late February 2018 Uber launched Express POOL in Los Angeles, San Diego, Denver, Philadelphia, Washington DC, and Miami. These markets experience similar positive effects from Express POOL that were observed in the original launch markets, and by expanding in these cities a few months after the original launch the team was able to synthesize learnings from San Francisco and Boston to better execute on the rollout strategy in these second wave locales. The third wave of domestic cities to get the new product was Chicago, Seattle, Atlanta, Las Vegas, and the New Jersey area in mid-May 2018. Finally, Express POOL went international with the launch of Paris, Sydney and Melbourne in August 2018. Attractive expansion markets exists across the globe and Uber hopes to bring the Express POOL product to all existing shared rides markets.
CONCLUSION
In conclusion, the research efforts to create the perfect POOL required close collaboration between the Uber user research and data science teams to understand rider preferences and the trade-offs they make when evaluating their transportation options. The ability to integrate both research methods enabled the team to provide compelling data to business leaders that was ultimately the single biggest input in developing the next iteration of uberPOOL. The resulting success of Express POOL provides a good example of how cross-pollination between disparate research methods can lead to positive business outcomes.
AUTHORS
Jenny Lo is a User Research manager at Uber. Jenny specializes in the study of quantitative research methods and information technology in developing countries (ICTD). She received her Masters of Information Management and Systems from the School of Information at University of California, Berkeley and Bachelors from Wesleyan University. Email: jlo@uber.com
Steve Morseman is a Data Scientist at Uber. His research focuses on rider acquisition, engagement, and product development. Steve received his Masters in Political Science from the University of California, Los Angeles and his Bachelors from the State University of New York at New Paltz. Email: morseman@uber.com
NOTES
We would like to thank Lisa Renery Handalian for going above and beyond for helping us work through multiple drafts of this paper. Chad Maxwell also provided invaluable feedback to improve the content for the EPIC audience.
1. uberX is a solo-trip in a typical sedan, with no carpooling with other riders; whereas uberBLACK is also a solo-trip, albeit taken in a premium vehicle with a professional driver.
2. The time since a rider created their account.
3. Uber researchers created the question set utilizing the OptBlock function in the AlgDesign package in R language for statistical programming.
4. Discrete choice models consist of the outcome variable (Yi) taking on a binary value of 0 or 1. Values are 0 in the absence of an event or 1 when an event occurs.
5. This required the dependent variable to take on a value of 0 or 1 to indicate the occurrence or absence of an answer choice selected in the survey. The data transformation requires turning a -1, 0, 1 dependent variable to 0 or 1, so if a respondent selects any answer choice the response variable will be coded as 1, or a 0 if the respondent didn’t select the answer at all.
6. Normalizing the coefficient estimates involves mean-centering the coefficients, exponentiating the mean-centered values, and renormalizing the exponentiated values by their sum.
7. A classic example of a product attributes is a computer. Features include hard drive size, processor speed, memory, screen size, etc. Each of these features can take on a variety of levels, such as having the choice of a 32gb, 64gb, or 128gb of memory when buying a new computer.
8. Purchasing refers to the process of opting to buy, subscribe, or otherwise spend money on a product or service. For the specific example of Uber, choosing to purchase the product means opting to take a given trip on the Uber platform.
9. The model used in this study is a Hierarchical Bayesian Multinomial-Logistic Regression Model.
10. 4 ETA levels * 3 Walking levels * 5 trip length levels * 3 trip variance levels * 5 discount levels = 900 possible profiles.
11. Sampled without replacement, meaning that each profile is only eligible to get selected once when randomizing each respondent’s question set.
12. The product profile randomization, question assignment, estimated-time-to-destination, and pricing calculations were completed utilizing a python script called from a php endpoint hit by the Qualtrics web service functionality. The server then returned a json-encoded string to Qualtrics with both the product package identifiers and text to render to the respondent.
13. For the maxdiff the data was binomial, where the dependent variable takes on a value of 0 or 1, but the multinomial distribution is a generalization of this data where the response variable can belong to one of the many different potential groups. The data generated in the conjoint is multinomial because they could have chosen product A, product B, or having opted out (product C).
14. Bayesian refers to the Markov Chain Monte Carlo process used to arrive at the estimated utility estimates, which uses a simulation approach that updates the information for each model run based upon the existing prior results from the previous iteration.
15. The rhierMnlRwMixture function was used to estimate the model. This function uses a hybrid sampler for hierarchical multinomial-logit with a mixture of normal priors.
16. For each iteration of the Markov-Chain, coefficients are estimated for each conjoint product feature-level for each respondent. In addition to these utility estimates, the posterior distribution of the Markov-Chains allow for the study of any control variables included in the respondent matrix.
17. Estimates were calculated over the second ⅔ of their Markov-Chain simulations, allowing for a burn-in period prior to estimates stabilizing, then averaging over the respondent level estimates to arrive at the global averages for each Uber product feature-level.
REFERENCES CITED
Cavusgil, Erin
2005 Seeing What’s next: Using the Theories of Innovation to Predict Industry change. Harvard Business School Press, Boston, MA, 2004. 312 Pages. European Journal of Marketing 39 (11/12): 1389–1390
Christensen, Clayton M., Scott Cook, and Taddy Hall
2016 “Marketing Malpractice.” In The Clayton M. Christensen Reader, 45-64. Harvard Business Review Press, Boston, MA, 2016. 224 Pages.
Collier, David, and James Mahoney
1996 Insights and Pitfalls: Selection Bias in Qualitative Research. World Politics 49(01): 56–91. http://www.jstor.org/stable/25053989
Epstein, Liana, Colette Des Georges, and Eric Van Susteren
2018 Comparing Isn’t Always a Piece of Cake: Ranking vs. Rating Explained. https://www.surveymonkey.com/curiosity/rating-vs-ranking/, accessed September 26, 2018
Graham, Mary E., and Daniel M. Cable
2001 Consideration of the Incomplete Block Design for Policy-Capturing Research. Organizational Research Methods 4(1): 26–45
Hawkins, Andrew J.
2018 Uber Express Pool Offers the Cheapest Fares Yet in Exchange for a Little Walking. The Verge. http://www.theverge.com/2018/2/21/17020484/uber-express-pool-launch-cities, accessed September 26, 2018
Hess, Stephane, and Andrew Daly
2014 Handbook of Choice Modelling. Cheltenham: Edward Elgar
Hosmer, David W., Stanley Lemeshow, and Rodney X. Sturdivant
2013 Applied Logistic Regression. Hoboken, NJ: Wiley
Lovelace, Matthew, and Peggy Brickman
2013 Best Practices for Measuring Students’ Attitudes toward Learning Science. CBE—Life Sciences Education 12(4): 606–617
Marley, Sarah
2018 Maximum Difference Scaling (MaxDiff). https://select-statistics.co.uk/blog/maximum-difference-scaling-maxdiff/, accessed September 26, 2018
Marley, Tony, and Pihlens, David
2012 Models of Best–Worst Choice and Ranking among Multiattribute Options (Profiles). Journal of Mathematical Psychology 56(1): 24–34
Porter, Stephen R., Michael E. Whitcomb, and William H. Weitzer
2004 Multiple Surveys of Students and Survey Fatigue. New Directions for Institutional Research 2004(121): 63–73
Qualtrics Support
2018 Question Randomization. https://www.qualtrics.com/support/survey-platform/survey-module/block-options/question-randoization/, accessed September 26, 2018
Qualtrics Support
2018 Quotas – Qualtrics. https://www.qualtrics.com/support/survey-platform/survey-module/survey-tools/quotas/, accessed September 26, 2018
Rossi, Peter
2017 CRAN – Package Bayesm. The Comprehensive R Archive Network. Comprehensive R Archive Network (CRAN). https://cran.r-project.org/web/packages/bayesm/index.html, accessed September 26, 2018
Rossi, Peter E., Greg M. Allenby, and Robert McCulloch
2009 Bayesian Statistics and Marketing. Chichester: Wiley
Sawtooth Software
2013 The MaxDiff System Technical Paper. http://www.sawtoothsoftware.com/download/techpap/maxdifftech.pdf, accessed September 25, 2018
Uber
2018 Uber Privacy. http://privacy.uber.com/policy, accessed September 26, 2018
Ulwick, Anthony
2016 Jobs to Be Done: Theory to Practice. s.l.: Idea Bite Press
Wheeler, Bob
2014 CRAN – Package AlgDesign. Algorithmic Experimental Design. https://cran.r-project.org/web/packages/AlgDesign/index.html, accessed September 25, 2018
Yap, Justin
2017 FlipMaxDiff – GitHub. https://github.com/Displayr/flipMaxDiff, accessed September 26, 2018
