Applied ethnography still struggles with the fundamental challenges of (1) framing research to obtain ‘thick’ data, (2) making sense of data in teams and with clients, and (3) making a convincing case with data in challenging environments. We have observed that borrowing from literary genres can...
Tag: visualization
Bringing the Security Analyst into the Loop: From Human-Computer Interaction to Human-Computer Collaboration
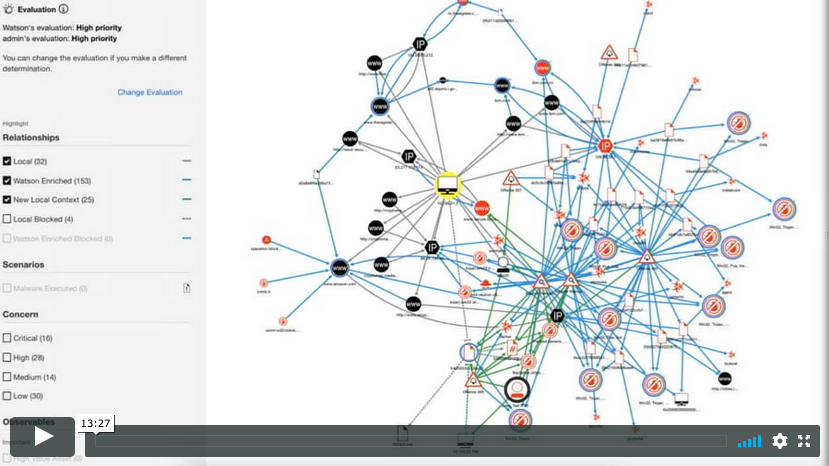
This case study examines how one Artificial Intelligence (AI) security software team made the decision to abandon a core feature of the product – an interactive Knowledge Graph visualization deemed by prospective buyers as “cool,” “impressive,” and “complex” – in favor of one that its users –...
Thinking & Communicating with Visual Frameworks
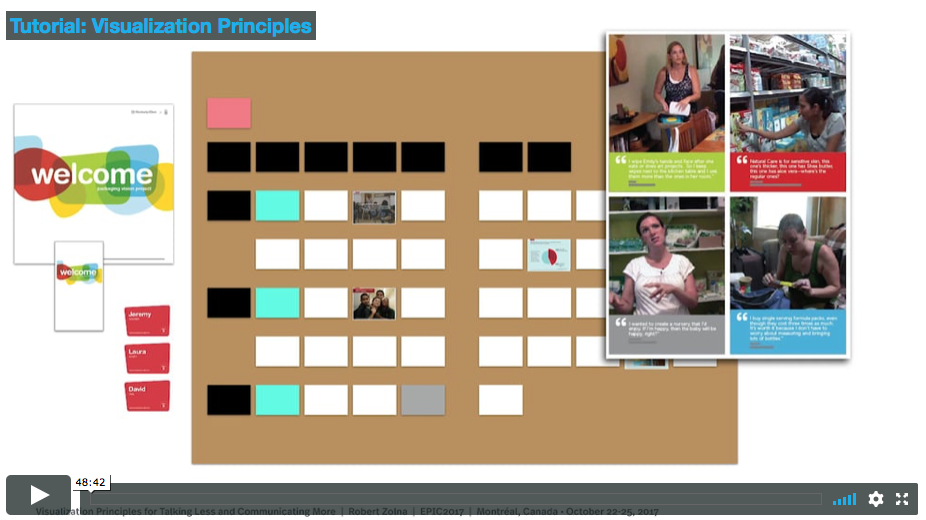
(This video has been edited to protect the privacy of participants in the original session.) This tutorial is a...
Same Findings, Different Story, Greater Impact: A Case Study in Communicating Research
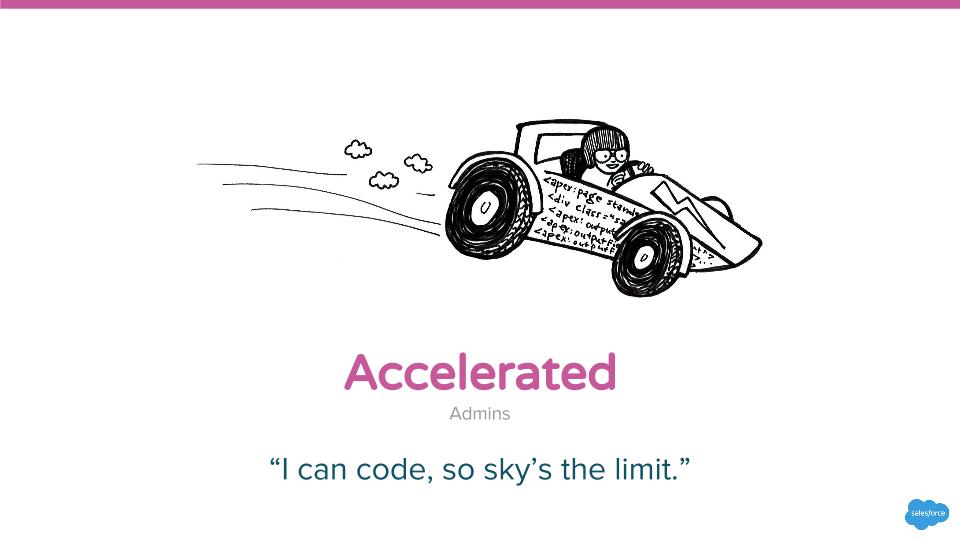
The Salesforce Platform empowers customers to build applications that are highly customized to their particular business operations and data. As platform researchers, we help create the tools that enable customers, including Salesforce administrators, to build these applications. Last year, the...
The EPIC Gallery: A Space for Action and Intervention
“We don’t fail because we are not intelligent or erudite enough; we fail because we don’t present our stakeholders with engaging material that will improve their ideas. We choose the medium which makes us comfortable, not the one our stakeholders would prefer.” — Sam Ladner, Practical Ethnography...
Tutorial: Visualization Principles for Talking Less and Communicating More
Overview A simple understanding of the principles of good information and visualization design can help in the presentation, comprehension, and socialization of your research insights and recommendations....
Tutorial: Information Design for Ethnographic Analysis
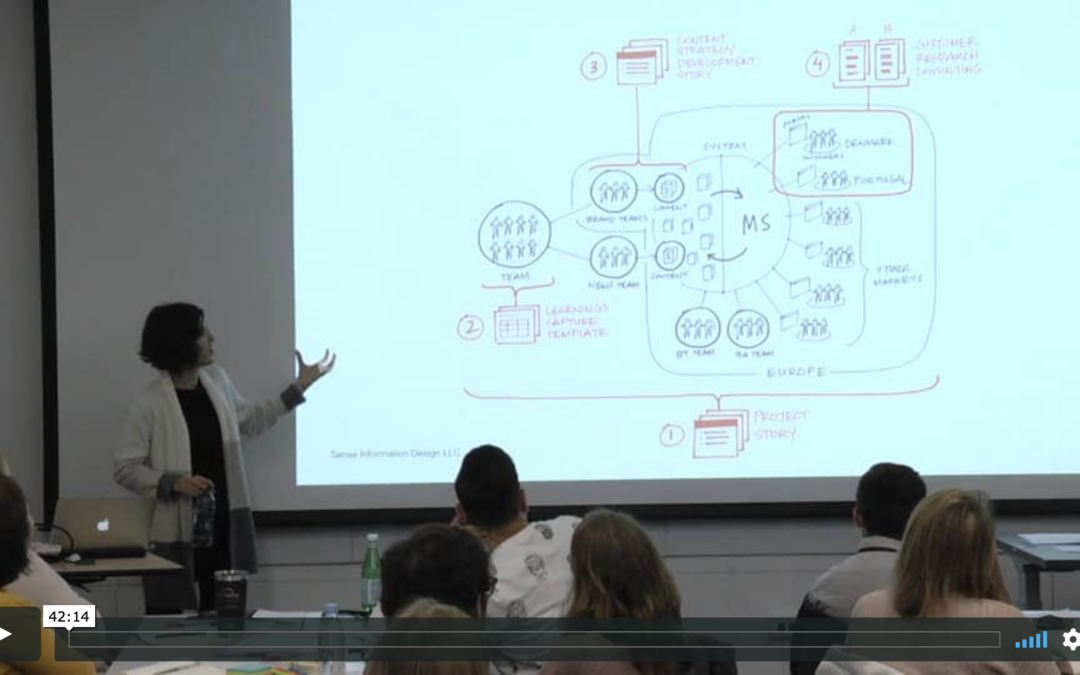
Overview Ethnographic analysis is the examination of raw data with an interpretative lens to identify themes, connections and patterns. How can you make this process more accessible to support data socialization...